Bojnūrd vs. Haarlem: Detailed 2026 Cost of Living & Quality Comparison
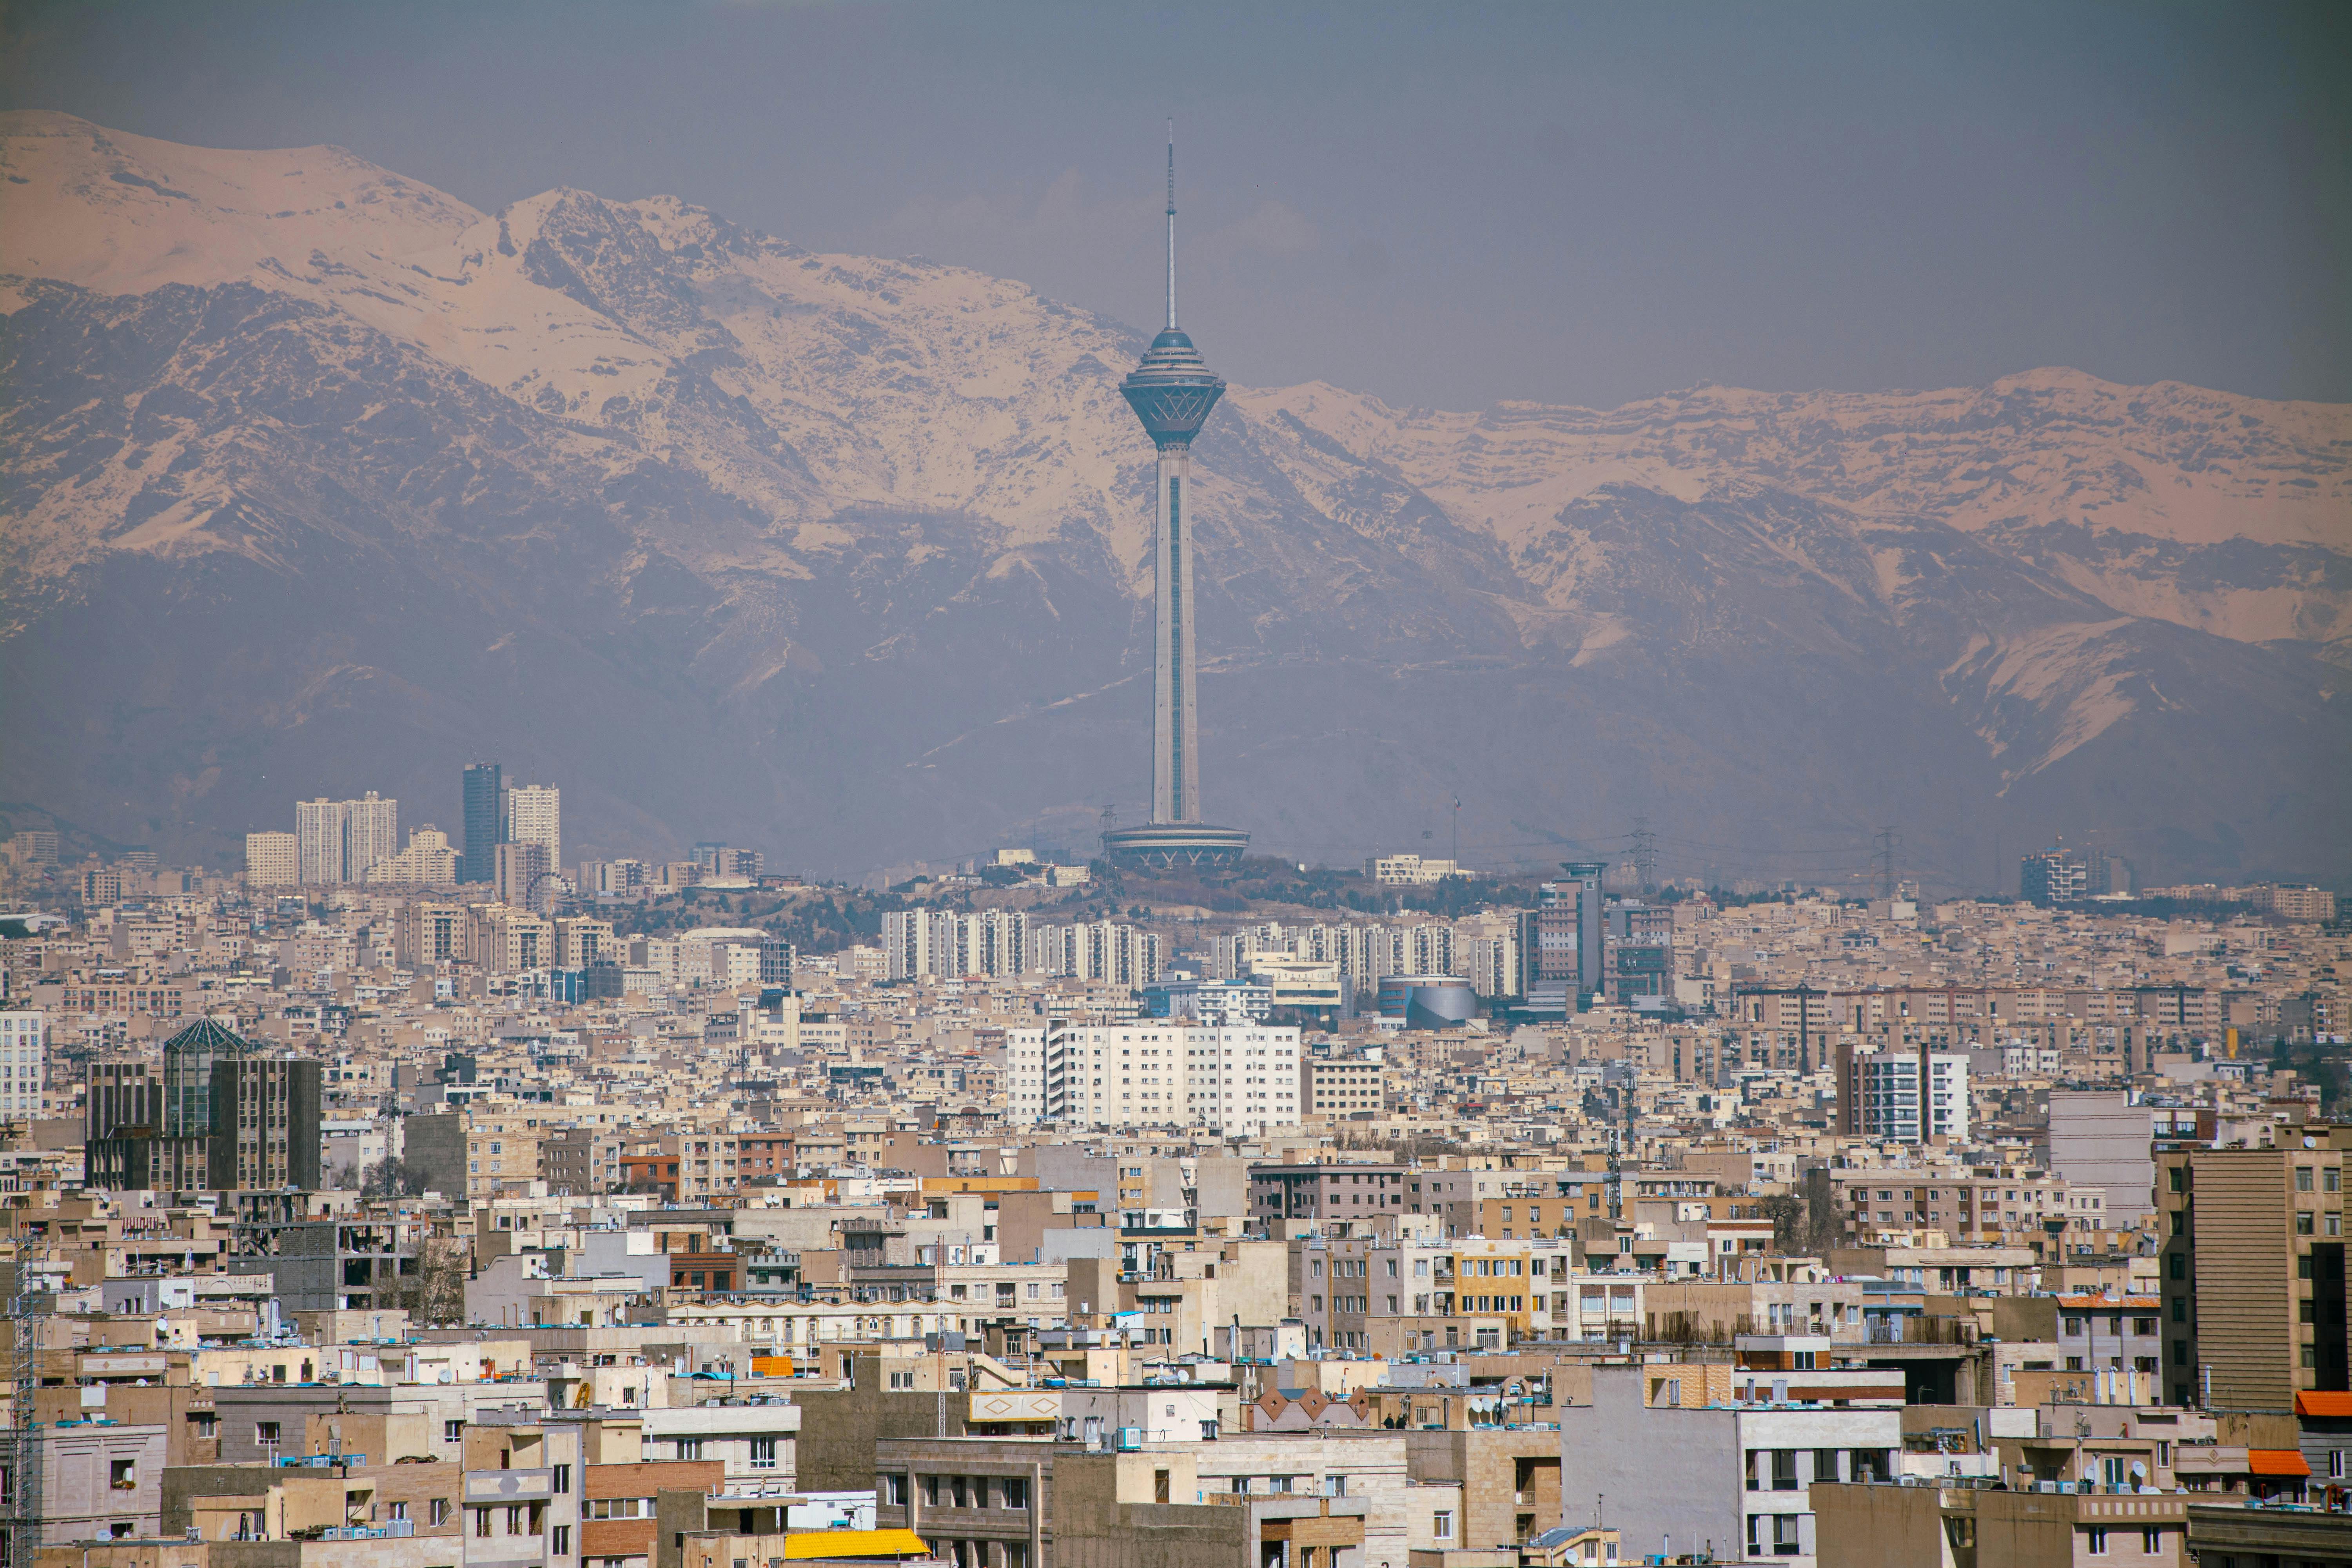 Bojnurd
Image by:Mehdi Salehi
Bojnurd
Image by:Mehdi Salehi
 Haarlem
Image by:Paul Julliot
Haarlem
Image by:Paul Julliot
Haarlem in the Netherlands presents a fundamentally different economic reality compared to Bojnūrd in Iran. The average monthly net salary in Haarlem is significantly higher at $3,903, more than double Bojnūrd's $200. This disparity is mirrored in housing costs, where a 1-bedroom apartment in Haarlem's city center rents for $1,932 per month, a stark contrast to the $200 figure in Bojnūrd. While Bojnūrd's cost of living index is higher at 307.98 than Haarlem's 72.64, the actual nominal costs for housing and presumably other goods and services are substantially greater in Haarlem, reflecting a different scale of expenses.
The economic landscape favors Haarlem significantly, particularly concerning housing finance. Haarlem offers a much lower annual mortgage interest rate of 4%, compared to Bojnūrd's exceptionally high rate of 50%. This difference profoundly impacts affordability and investment potential. The purchase price per square meter for comparable properties in Haarlem ranges from $6,348 to $8,160, considerably higher than Bojnūrd's range of $350 to $650. This combination of higher nominal costs and extremely high borrowing costs in Bojnūrd presents a challenging environment for property investment and ownership.
Haarlem demonstrates clear advantages in quality of life metrics. The city's safety index is significantly higher at 75.63, while Bojnūrd's data is unavailable. Health care and climate indices are considerably better in Haarlem (77.12 and 88.21 respectively) than the limited data available for Bojnūrd. Pollution levels are also lower in Haarlem (23.14) than the unavailable data for Bojnūrd. Although specific quality metrics for Bojnūrd are scarce, the higher Purchasing Power Index (129.06) in Haarlem suggests a different calculation than the cost of living index, further indicating a more favorable position for residents.
For investment and career prospects, Haarlem appears more promising. It maintains a healthy GDP growth rate of 0.07%, albeit with a modest population growth rate of 0.39%. Bojnūrd faces substantial economic uncertainty, highlighted by its extremely high 50% annual mortgage interest rate, which creates significant barriers to investment and long-term financial planning. The property price to income ratio in Haarlem is 9.33, reflecting the high costs but also the higher incomes. This ratio is difficult to calculate directly for Bojnūrd due to its high interest rates and lower incomes, but the conditions point towards a less secure investment environment.
Ultimately, the comparison reveals two divergent urban experiences. Haarlem offers superior economic stability, higher incomes, lower mortgage rates, better public services, and a safer environment, making it attractive for long-term security and quality of life. Bojnūrd, while nominally cheaper for goods and housing, presents a less secure economic picture due to its extremely high interest rates and lower income levels. The choice between these cities depends entirely on individual priorities, with Haarlem favoring financial stability and well-being, while Bojnūrd appeals to those prioritizing extreme cost savings despite significant economic drawbacks.
 Bojnurd
 Haarlem
Local cuisine & dishes
Bojnurd
Haarlem
 Bojnurd
 Haarlem
Travel & attractions
Bojnurd
Haarlem
Real estate & living comparison
| Bojnurd | Haarlem | |
|---|---|---|
| Price per Square Meter to Buy Apartment in City Centre | 650 USD | 8159.96 USD |
| Price per Square Meter to Buy Apartment Outside of Centre | 350 USD | 6347.86 USD |
| Apples (1 kg) | 1.2 USD | 3.21 USD |
| Bananas (1 kg) | 2 USD | 2.58 USD |
| 1 Bedroom Apartment in City Centre | 200 USD | 1931.85 USD |
| 1 Bedroom Apartment Outside of City Centre | 100 USD | 1712.92 USD |
| Annual Mortgage Interest Rate (20-Year Fixed, in %) | 50 USD | 4 USD |
| Average Monthly Net Salary (After Tax) | 200 USD | 3885.52 USD |
| Taxi 1 Hour Waiting (Standard Tariff) | 2 USD | 27.12 USD |
| Taxi Start (Standard Tariff) | 0.2 USD | 5.96 USD |
| Population | 228,931 | 162,543 |
Last updated: 2026-04-05T15:42:28+00:00
Comments for this comparison