Murmansk vs. Neiva: Detailed 2026 Cost of Living & Quality Comparison
 Murmansk
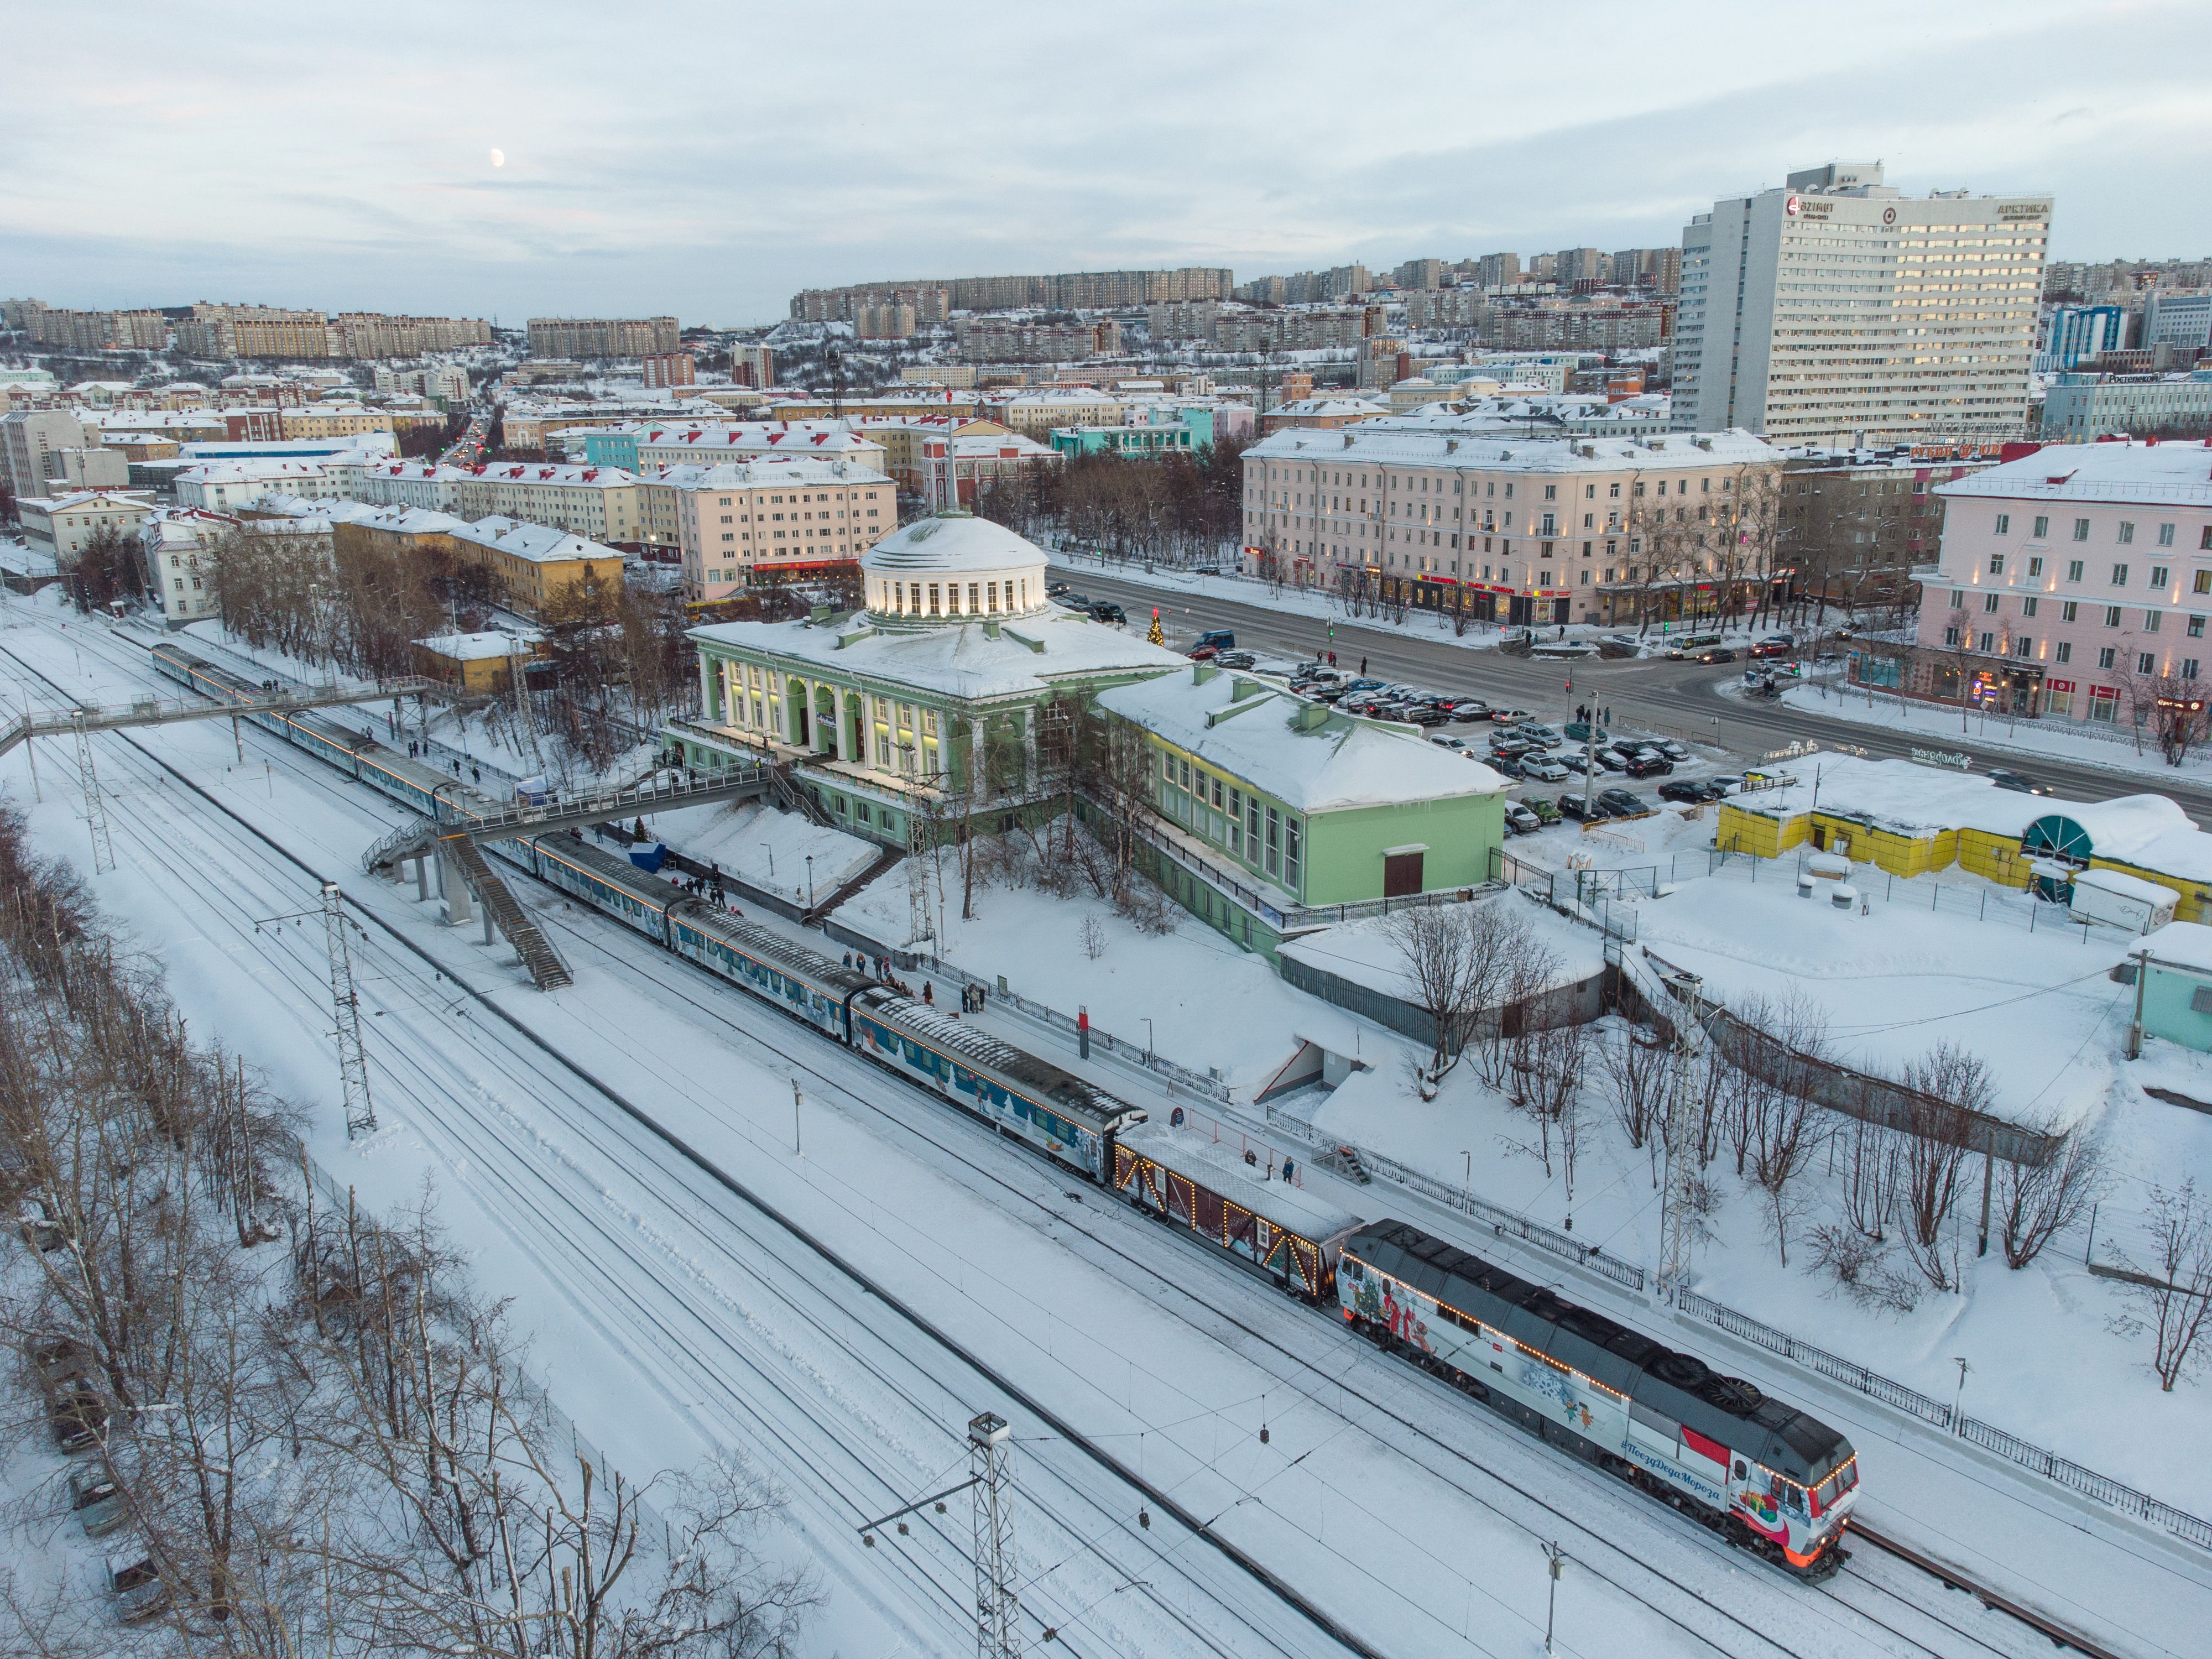
Image by:Dmitry Gornaev
Murmansk
Image by:Dmitry Gornaev
 Neiva
Image by:Cristhian Covaleda
Neiva
Image by:Cristhian Covaleda
Murmansk and Neiva present fundamentally different economic profiles for 2026. The Russian Arctic city boasts a significantly higher GDP per capita, estimated at $39,800, reflecting its industrial base and port significance. This contrasts sharply with Neiva's $18,700 GDP per capita, characteristic of its status as a major Colombian city. Both cities experienced identical population growth in 2026, at 0.49%, but the economic divergence is stark. Murmansk offers substantially higher average net salaries, around $1,090 monthly, which aligns with its higher GDP but also faces a dramatically higher mortgage interest rate of 30.0% annually. Neiva, while having a lower average net salary of $394 monthly, benefits from a much lower mortgage rate of 12.0%. This combination points to a clear economic divergence, with Murmansk's figures significantly higher except for the mortgage rate comparison.
The cost of living gap between these two cities is pronounced, particularly concerning housing. Neiva's overall cost of living is considerably lower than Murmansk's, driven by cheaper housing, food, and transportation. This translates directly into the salaries: despite the higher net salary in Murmansk, the city's vastly higher cost of living, especially the exorbitant 30.0% mortgage rate, presents a significant financial challenge. Neiva's lower cost structure, reflected in its lower salaries ($394 vs. $1,090), is offset by a much more affordable environment, making it a more financially sustainable option for many, particularly regarding housing expenses.
Quality of life metrics consistently favor Neiva, despite its location in a developing country. The city performs significantly better across key areas like safety and healthcare access, scoring considerably higher on relevant indices than Murmansk. Murmansk's quality of life scores are notably low, particularly in safety (55.88) and climate (23.23), reflecting its harsh Arctic environment. While Murmansk offers a unique Arctic lifestyle, the data indicates Neiva provides a superior environment concerning personal safety, healthcare availability, and general living conditions, making it the preferred choice for those prioritizing these fundamental aspects.
For investment and career considerations in 2026, the data presents contrasting scenarios. Murmansk's higher GDP per capita ($39,800 vs. $18,700) and established industrial base offer certain investment possibilities, particularly in sectors aligned with its economy. However, the high mortgage rates and lower average net salary ($1,090) compared to its GDP might deter some investors focused on residential real estate or personal financial planning. Neiva, with its lower GDP per capita and salaries, faces a lower GDP growth rate, but its significantly lower cost of living and lower mortgage rates ($12.0%) create a more attractive proposition for businesses seeking operational affordability or individuals seeking lower overhead, despite the lower income levels.
Ultimately, the comparison between Murmansk and Neiva highlights two distinct worlds. Neiva leads decisively in quality of life indices and offers a substantially lower cost of living, albeit with lower average salaries and a lower GDP per capita. Murmansk, conversely, offers a higher GDP per capita and correspondingly higher salaries, but presents a challenging environment with significantly lower quality of life scores, a harsh climate, and extremely high mortgage rates. The choice hinges entirely on priorities: a focus on safety, healthcare, lower expenses, and affordable housing strongly favors Neiva, while a focus on higher income, established economic infrastructure, and the unique Arctic setting points towards Murmansk, despite its considerable drawbacks in quality of life and financial costs.
 Murmansk
 Neiva
NeivaLocal cuisine & dishes
Murmansk
Neiva
 Murmansk
 Neiva
NeivaTravel & attractions
Murmansk
Neiva
Real estate & living comparison
| Murmansk | Neiva | |
|---|---|---|
| Nike Running Shoes (Mid-Range) | 116.17 USD | 65.73 USD |
| Apples (1 kg) | 1.94 USD | 1.58 USD |
| Bananas (1 kg) | 1.94 USD | 0.97 USD |
| Bottled Water (0.33 Liter) | 0.67 USD | 0.53 USD |
| Cappuccino (Regular Size) | 2.34 USD | 1.45 USD |
| Annual Mortgage Interest Rate (20-Year Fixed, in %) | 30 USD | 12 USD |
| Average Monthly Net Salary (After Tax) | 1090.63 USD | 398.14 USD |
| Cinema Ticket (International Release) | 4.2 USD | 3.81 USD |
| Gasoline (1 Liter) | 0.8 USD | 0.84 USD |
| One-Way Ticket (Local Transport) | 0.65 USD | 0.66 USD |
| Basic Utilities for 85 m2 Apartment (Electricity, Heating, Cooling, Water, Garbage) | 168.8 USD | 78.88 USD |
| Broadband Internet (Unlimited Data, 60 Mbps or Higher) | 9.16 USD | 13.15 USD |
| Population | 267,422 | 380,019 |
Last updated: 2026-04-05T15:41:19+00:00
Comments for this comparison