Nizhnekamsk vs. Samsun: Detailed 2026 Cost of Living & Quality Comparison
 Nizhnekamsk
Image by:Van Mailian
Nizhnekamsk
Image by:Van Mailian
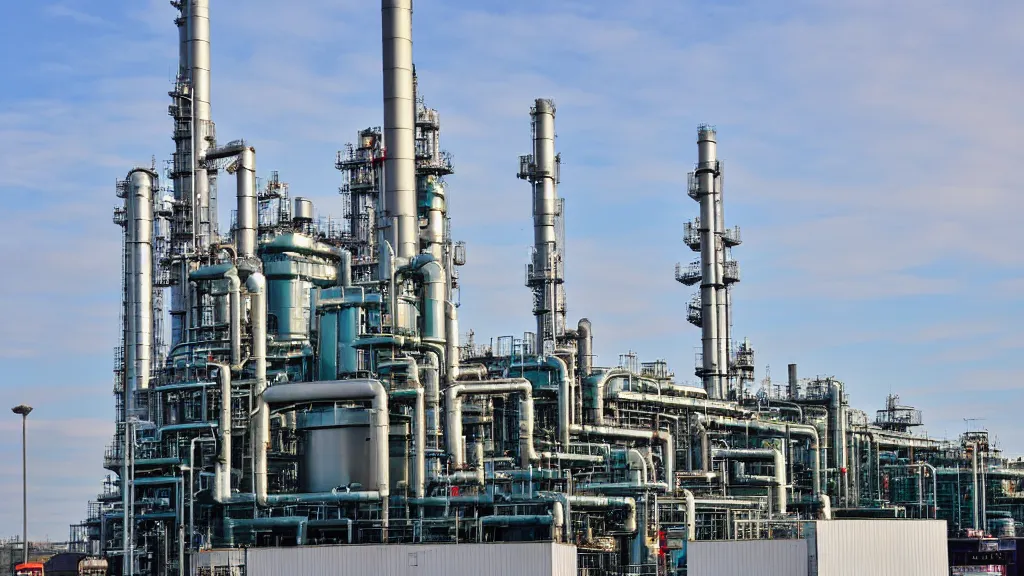
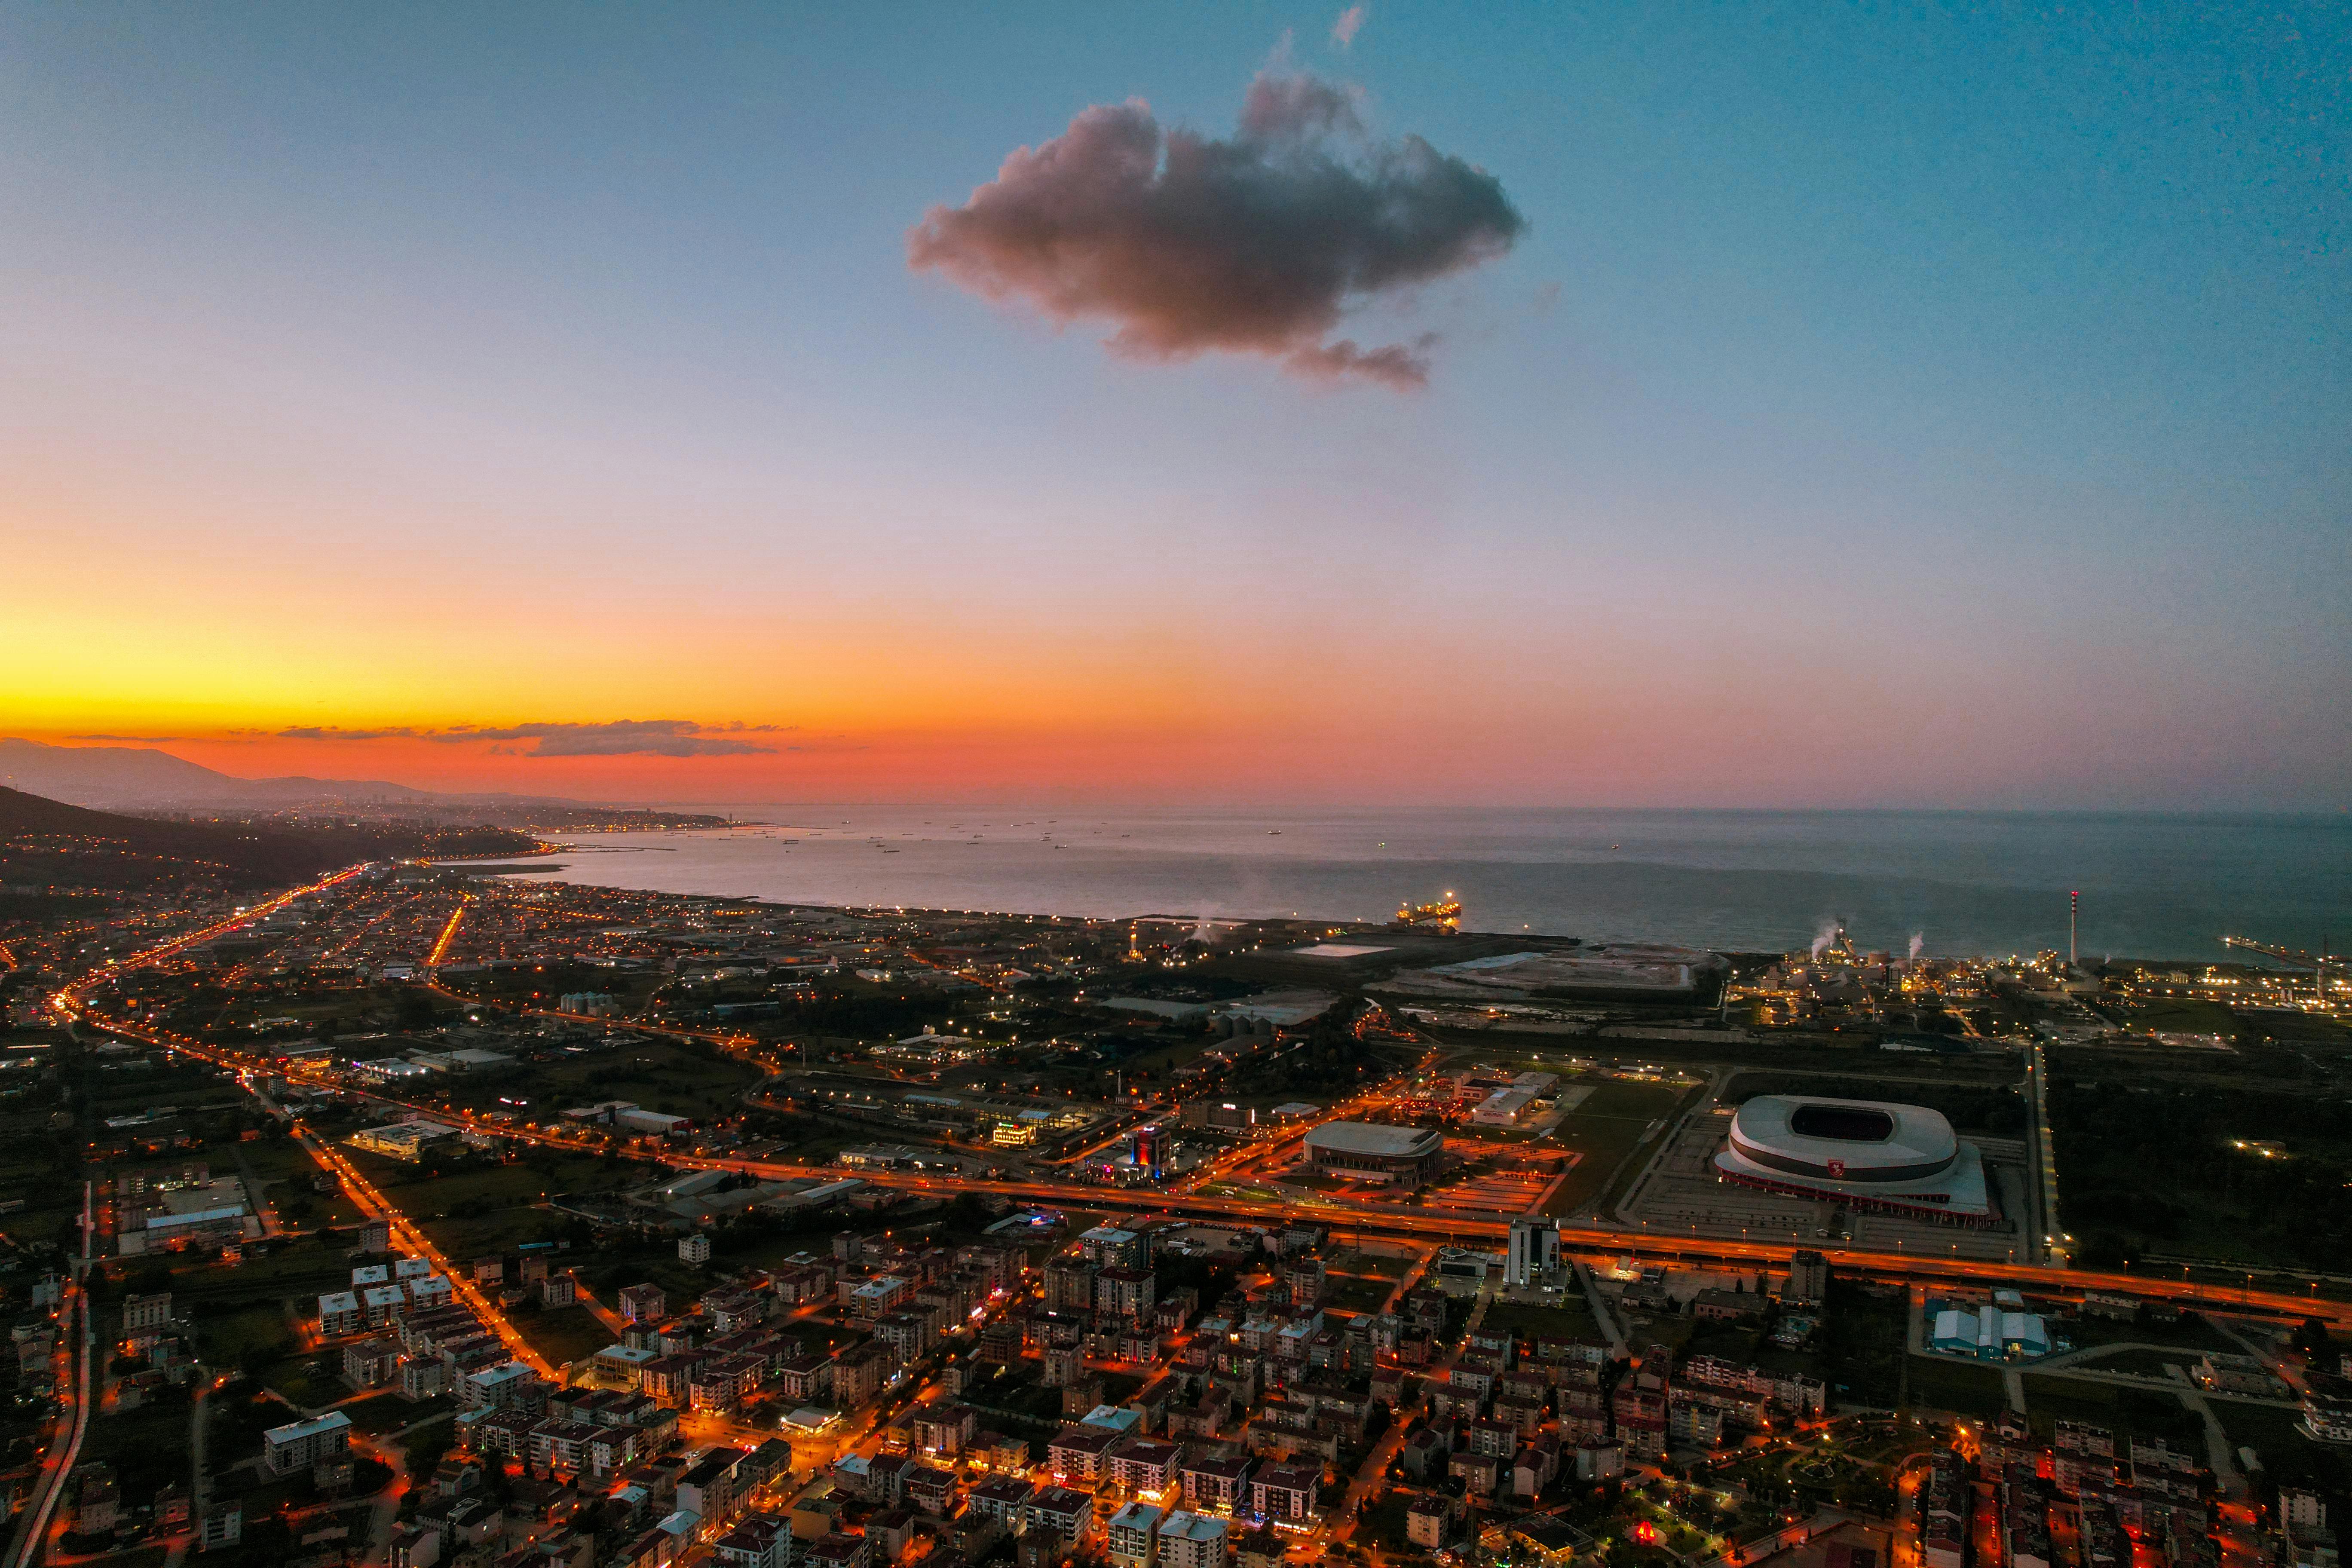 Samsun
Image by:Lensloji
Samsun
Image by:Lensloji
Samsun presents a significantly more lucrative economic environment compared to Nizhnekamsk, evidenced by its higher average net monthly salary of $1042.37 USD. While Nizhnekamsk's economic profile is less detailed regarding direct income figures, its overall cost of living index remains substantially lower, hovering generally below 200, suggesting that basic expenses might be comparatively more affordable than in Samsun, where indices frequently exceed 300. However, this lower cost of living index in Nizhnekamsk does not necessarily translate to lower costs for essential goods and services across the board, as the data picture is less complete for these specific items than for Samsun.
The housing market starkly contrasts between the two cities. Samsun offers substantially more accessible housing, both in terms of purchase and rental. City center apartment prices average around $3820.77 USD per square meter, a figure considerably lower than comparable Nizhnekamsk data. Rent reflects this, with a typical city center one-bedroom apartment in Samsun costing about $447.27 USD per month. This lower rental cost in Samsun, however, comes at the cost of potentially higher mortgage rates, where data indicates rates can reach 49%, a figure notably higher than typical rates within the Russian financial system, although specific Nizhnekamsk mortgage details were not provided.
Assessing quality of life reveals a complex picture, with Samsun generally appearing more favorable based on available indices. It demonstrates higher safety metrics, lower pollution levels, and better climate indices than the sparse data allows for Nizhnekamsk. While Nizhnekamsk provides information on healthcare access and environmental concerns like industrial emissions, the specific indices measuring safety, climate comfort, and pollution are notably absent for this city, making a comprehensive quality comparison in these areas difficult. Samsun's data suggests a potentially more comfortable urban environment with superior public services in the measured aspects of safety, climate, and air quality.
For individuals weighing relocation or investment, Samsun's higher GDP per capita ($34,600 USD) and slightly higher population growth rate (0.61%) signal a potentially more dynamic economic landscape than the national Russian averages. This, combined with the higher salaries, suggests better career opportunities and potentially faster professional growth. Conversely, Nizhnekamsk offers a different proposition: a lower cost of living overall, but within the framework of the Russian Federation's economy, likely presenting fewer high-income job opportunities and a different career trajectory. The choice hinges on whether the potential for higher earnings and a potentially better quality of life in Samsun outweighs the lower expenses and different economic context of Nizhnekamsk.
Ultimately, the decision between Nizhnekamsk and Samsun hinges on individual priorities. Samsun offers a higher standard of living, reflected in potentially better quality of life indicators, higher salaries, and more accessible housing, but this comes with significantly higher overall living expenses. Nizhnekamsk provides a lower cost of living but exists within a distinct economic and cultural framework, likely offering fewer high-paying jobs and different quality-of-life metrics. The ideal choice depends entirely on whether the tolerance for higher living costs aligns with the potential for higher income and a potentially superior quality of life in Samsun, or if the lower expenses and different economic reality of Nizhnekamsk are preferable.
 Nizhnekamsk
 Samsun
Local cuisine & dishes
Nizhnekamsk
 Nizhnekamsk
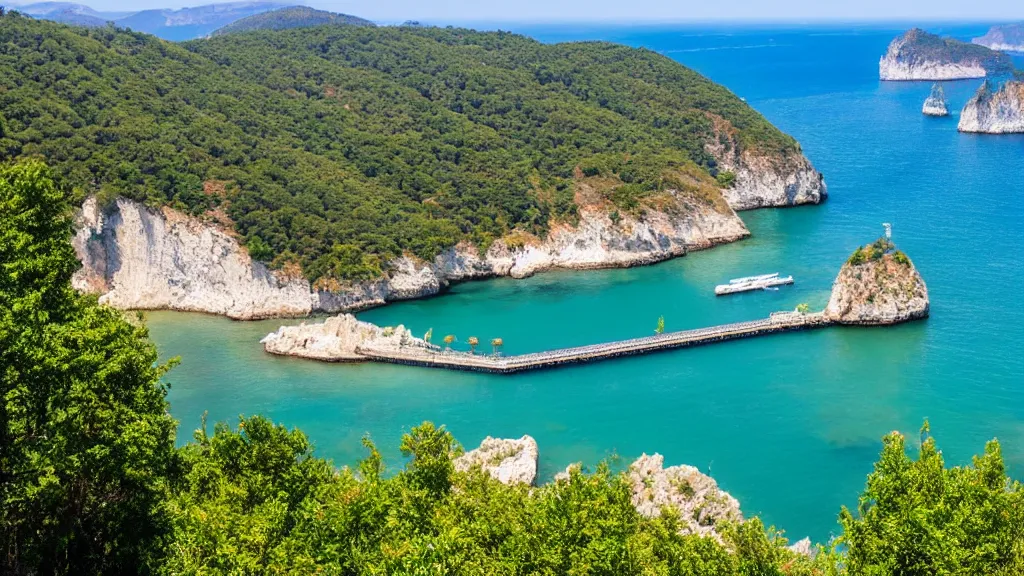 Samsun
Travel & attractions
Nizhnekamsk
Samsun
Real estate & living comparison
| Nizhnekamsk | Samsun | |
|---|---|---|
| International Primary School, Annual Tuition per Child | 5162.76 USD | 3411.4 USD |
| Private Full-Day Preschool or Kindergarten, Monthly Fee per Child | 387.21 USD | 369.57 USD |
| Jeans (Levi's 501 or Similar) | 77.44 USD | 31.84 USD |
| Men's Leather Business Shoes | 116.16 USD | 54.01 USD |
| Apples (1 kg) | 2.04 USD | 2.27 USD |
| Bananas (1 kg) | 2.04 USD | 2.16 USD |
| Bottled Water (0.33 Liter) | 0.52 USD | 0.23 USD |
| Cappuccino (Regular Size) | 2.29 USD | 3.18 USD |
| Annual Mortgage Interest Rate (20-Year Fixed, in %) | 22 USD | 49 USD |
| GDP Growth Rate: | 3.6 USD | 5.11 USD |
| Cinema Ticket (International Release) | 5.16 USD | 4.55 USD |
| Gasoline (1 Liter) | 0.78 USD | 1.25 USD |
| One-Way Ticket (Local Transport) | 0.52 USD | 0.64 USD |
| Basic Utilities for 85 m2 Apartment (Electricity, Heating, Cooling, Water, Garbage) | 125.16 USD | 70.12 USD |
| Broadband Internet (Unlimited Data, 60 Mbps or Higher) | 6.88 USD | 11.75 USD |
| Population | 240,379 | 1,356,079 |
Last updated: 2026-04-05T12:06:04+00:00
Comments for this comparison