Ouagadougou vs. Redding: Detailed 2026 Cost of Living & Quality Comparison
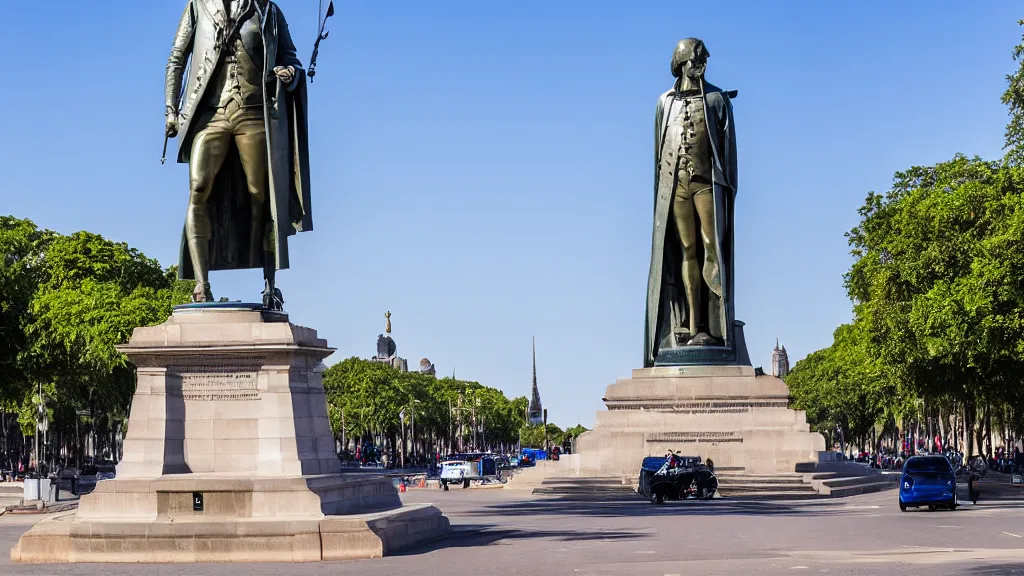
 Ouagadougou
Image by:Ole Dahl Rasmussen
Ouagadougou
Image by:Ole Dahl Rasmussen
 Redding
Image by:Florian Grewe
Redding
Image by:Florian Grewe
Ouagadougou, Burkina Faso, presents a fundamentally different reality compared to Redding, California. The economic landscape is stark, with Ouagadougou's GDP per capita at $7,460, a fraction of Redding's $74,600. This disparity translates directly into living standards, reflected in average net salaries – a mere $746 monthly in Ouagadougou versus $3,593 in Redding, a difference of nearly 369%. Quality of life indicators also show a clear gap, with Redding scoring significantly higher across various metrics, suggesting a vastly superior standard of living overall, despite Ouagadougou being considerably more affordable in broad terms.
The cost of living varies dramatically between these cities, particularly for basic necessities. Ouagadougou is substantially cheaper for everyday groceries, household essentials, and dining out. A mid-range restaurant meal for two costs around $15 in Ouagadougou versus $105 in Redding. Even staples like rice and bread are more affordable in Burkina Faso. However, Redding demonstrates superior affordability in areas reflecting its developed economy, such as healthcare, childcare, and certain luxury goods like electronics and clothing. Transportation costs also differ, with Ouagadougou's gasoline at $0.97/L and public transport passes at $1.50/month, compared to Redding's higher gasoline price ($1.22/L) and significantly more expensive monthly pass ($50). Despite Ouagadougou's lower base costs, Redding offers better value in key services like healthcare and childcare.
Housing represents one of the most pronounced contrasts, with Ouagadougou's property prices being exceptionally low. The average price per square meter is $268, regardless of location, compared to Redding's premium rate of $2,698. This significant difference in asset value directly correlates with the vast economic disparity, as Ouagadougou's GDP per capita is roughly 100 times lower than Redding's. While Ouagadougou's population growth rate is 2.89%, its GDP growth is projected at 2.89%, contrasting with Redding's slower, more stable 0.67% growth rate. The economic structure and infrastructure investment also differ markedly, reflected in Ouagadougou's lower public transport costs ($1.50/month) versus Redding's $50/month pass.
Utility costs further highlight the economic divide, with Ouagadougou's basic utilities for an 85m² apartment costing just $40 monthly, compared to Redding's $226. Transportation costs also show Ouagadougou as more affordable, with taxi rides at $2.03/km and the monthly public transport pass at $1.50, versus Redding's $3.25/km and $50/month pass. While Ouagadougou's public transport system appears more cost-effective relative to its economic scale, Redding's infrastructure is undeniably more developed. Healthcare access and quality also differ significantly, with Ouagadougou lacking specialized facilities found in Redding, though specific cost data for Ouagadougou wasn't provided.
Childcare expenses underscore the gap in services and investment. Ouagadougou lacks specific data points, but Redding offers private preschool fees around $3,018 monthly and international primary school tuition of $42,000 annually, indicating vastly different educational landscapes. Looking ahead, Ouagadougou's projected population growth of 2.89% suggests potential expansion, but its core economic indicators remain substantially lower than Redding's. Redding appears stable and established with higher living standards, while Ouagadougou offers lower costs but significantly fewer amenities, services, and overall quality of life. The decision between these cities hinges on prioritizing extreme affordability against comprehensive quality, stability, and access to services.
 Ouagadougou
 Redding
Local cuisine & dishes
Ouagadougou
Redding
 Ouagadougou
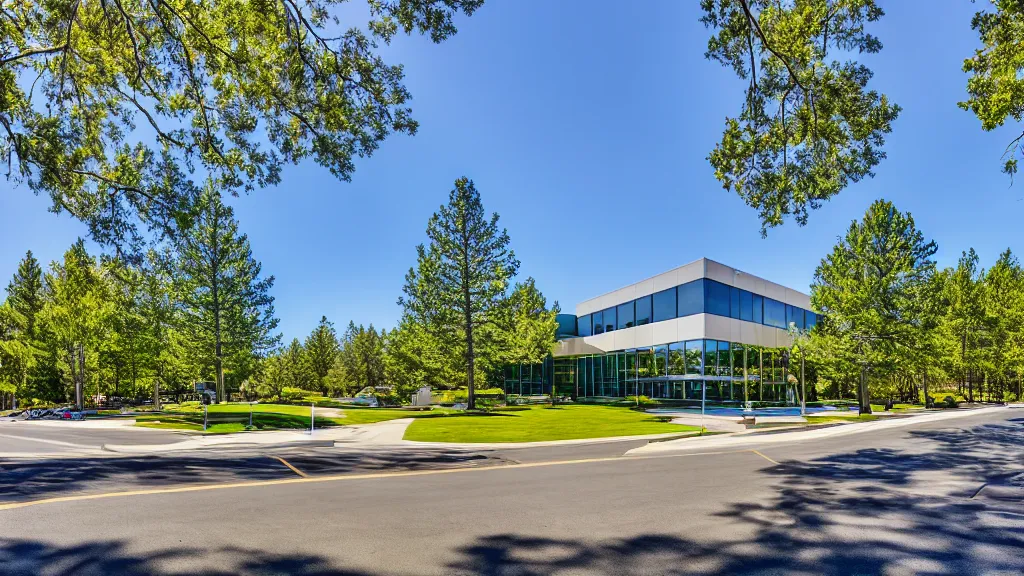 Redding
Travel & attractions
Ouagadougou
Redding
Real estate & living comparison
| Ouagadougou | Redding | |
|---|---|---|
| Price per Square Meter to Buy Apartment in City Centre | 233.39 USD | 2698.33 USD |
| Price per Square Meter to Buy Apartment Outside of Centre | 116.69 USD | 2698.33 USD |
| International Primary School, Annual Tuition per Child | 17634.35 USD | 42000 USD |
| Apples (1 kg) | 4.45 USD | 5.83 USD |
| Bananas (1 kg) | 1 USD | 1.65 USD |
| 1 Bedroom Apartment in City Centre | 474.39 USD | 1300 USD |
| 1 Bedroom Apartment Outside of City Centre | 278.7 USD | 1050 USD |
| Bottled Water (0.33 Liter) | 0.68 USD | 2.25 USD |
| Cappuccino (Regular Size) | 1.48 USD | 5.25 USD |
| Average Monthly Net Salary (After Tax) | 485.88 USD | 3593.33 USD |
| GDP Growth Rate: | 2.96 USD | 2.89 USD |
| Cinema Ticket (International Release) | 8.89 USD | 9.12 USD |
| Monthly Fitness Club Membership | 80.05 USD | 57 USD |
| Gasoline (1 Liter) | 1.51 USD | 1.22 USD |
| One-Way Ticket (Local Transport) | 0.18 USD | 1.5 USD |
| Basic Utilities for 85 m2 Apartment (Electricity, Heating, Cooling, Water, Garbage) | 159.22 USD | 226.19 USD |
| Broadband Internet (Unlimited Data, 60 Mbps or Higher) | 50.34 USD | 68.5 USD |
| Population | 3,063,271 | 120,849 |
Last updated: 2026-04-05T04:47:53+00:00
Comments for this comparison