San José vs. Mymensingh: Detailed 2026 Cost of Living & Quality Comparison
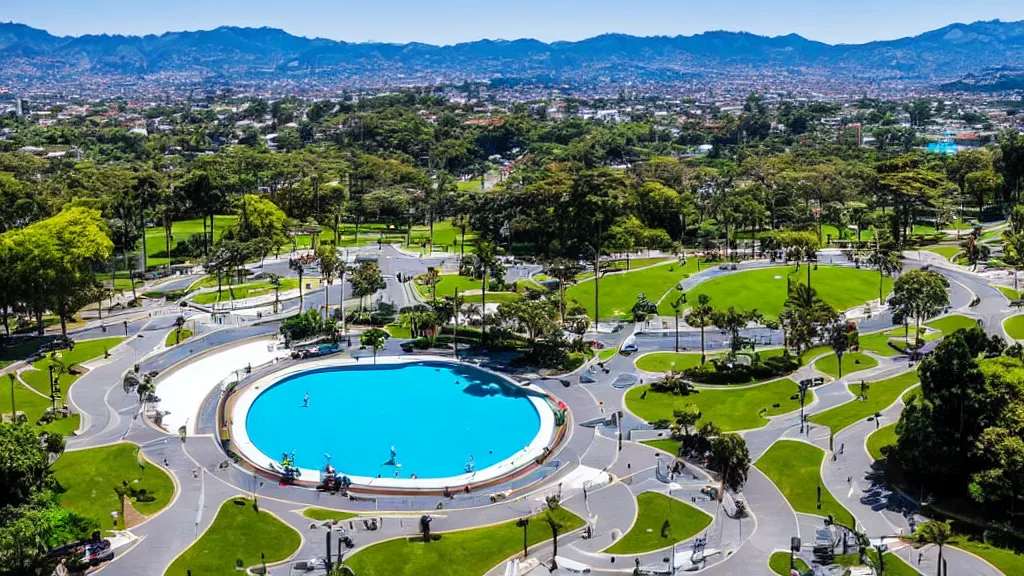
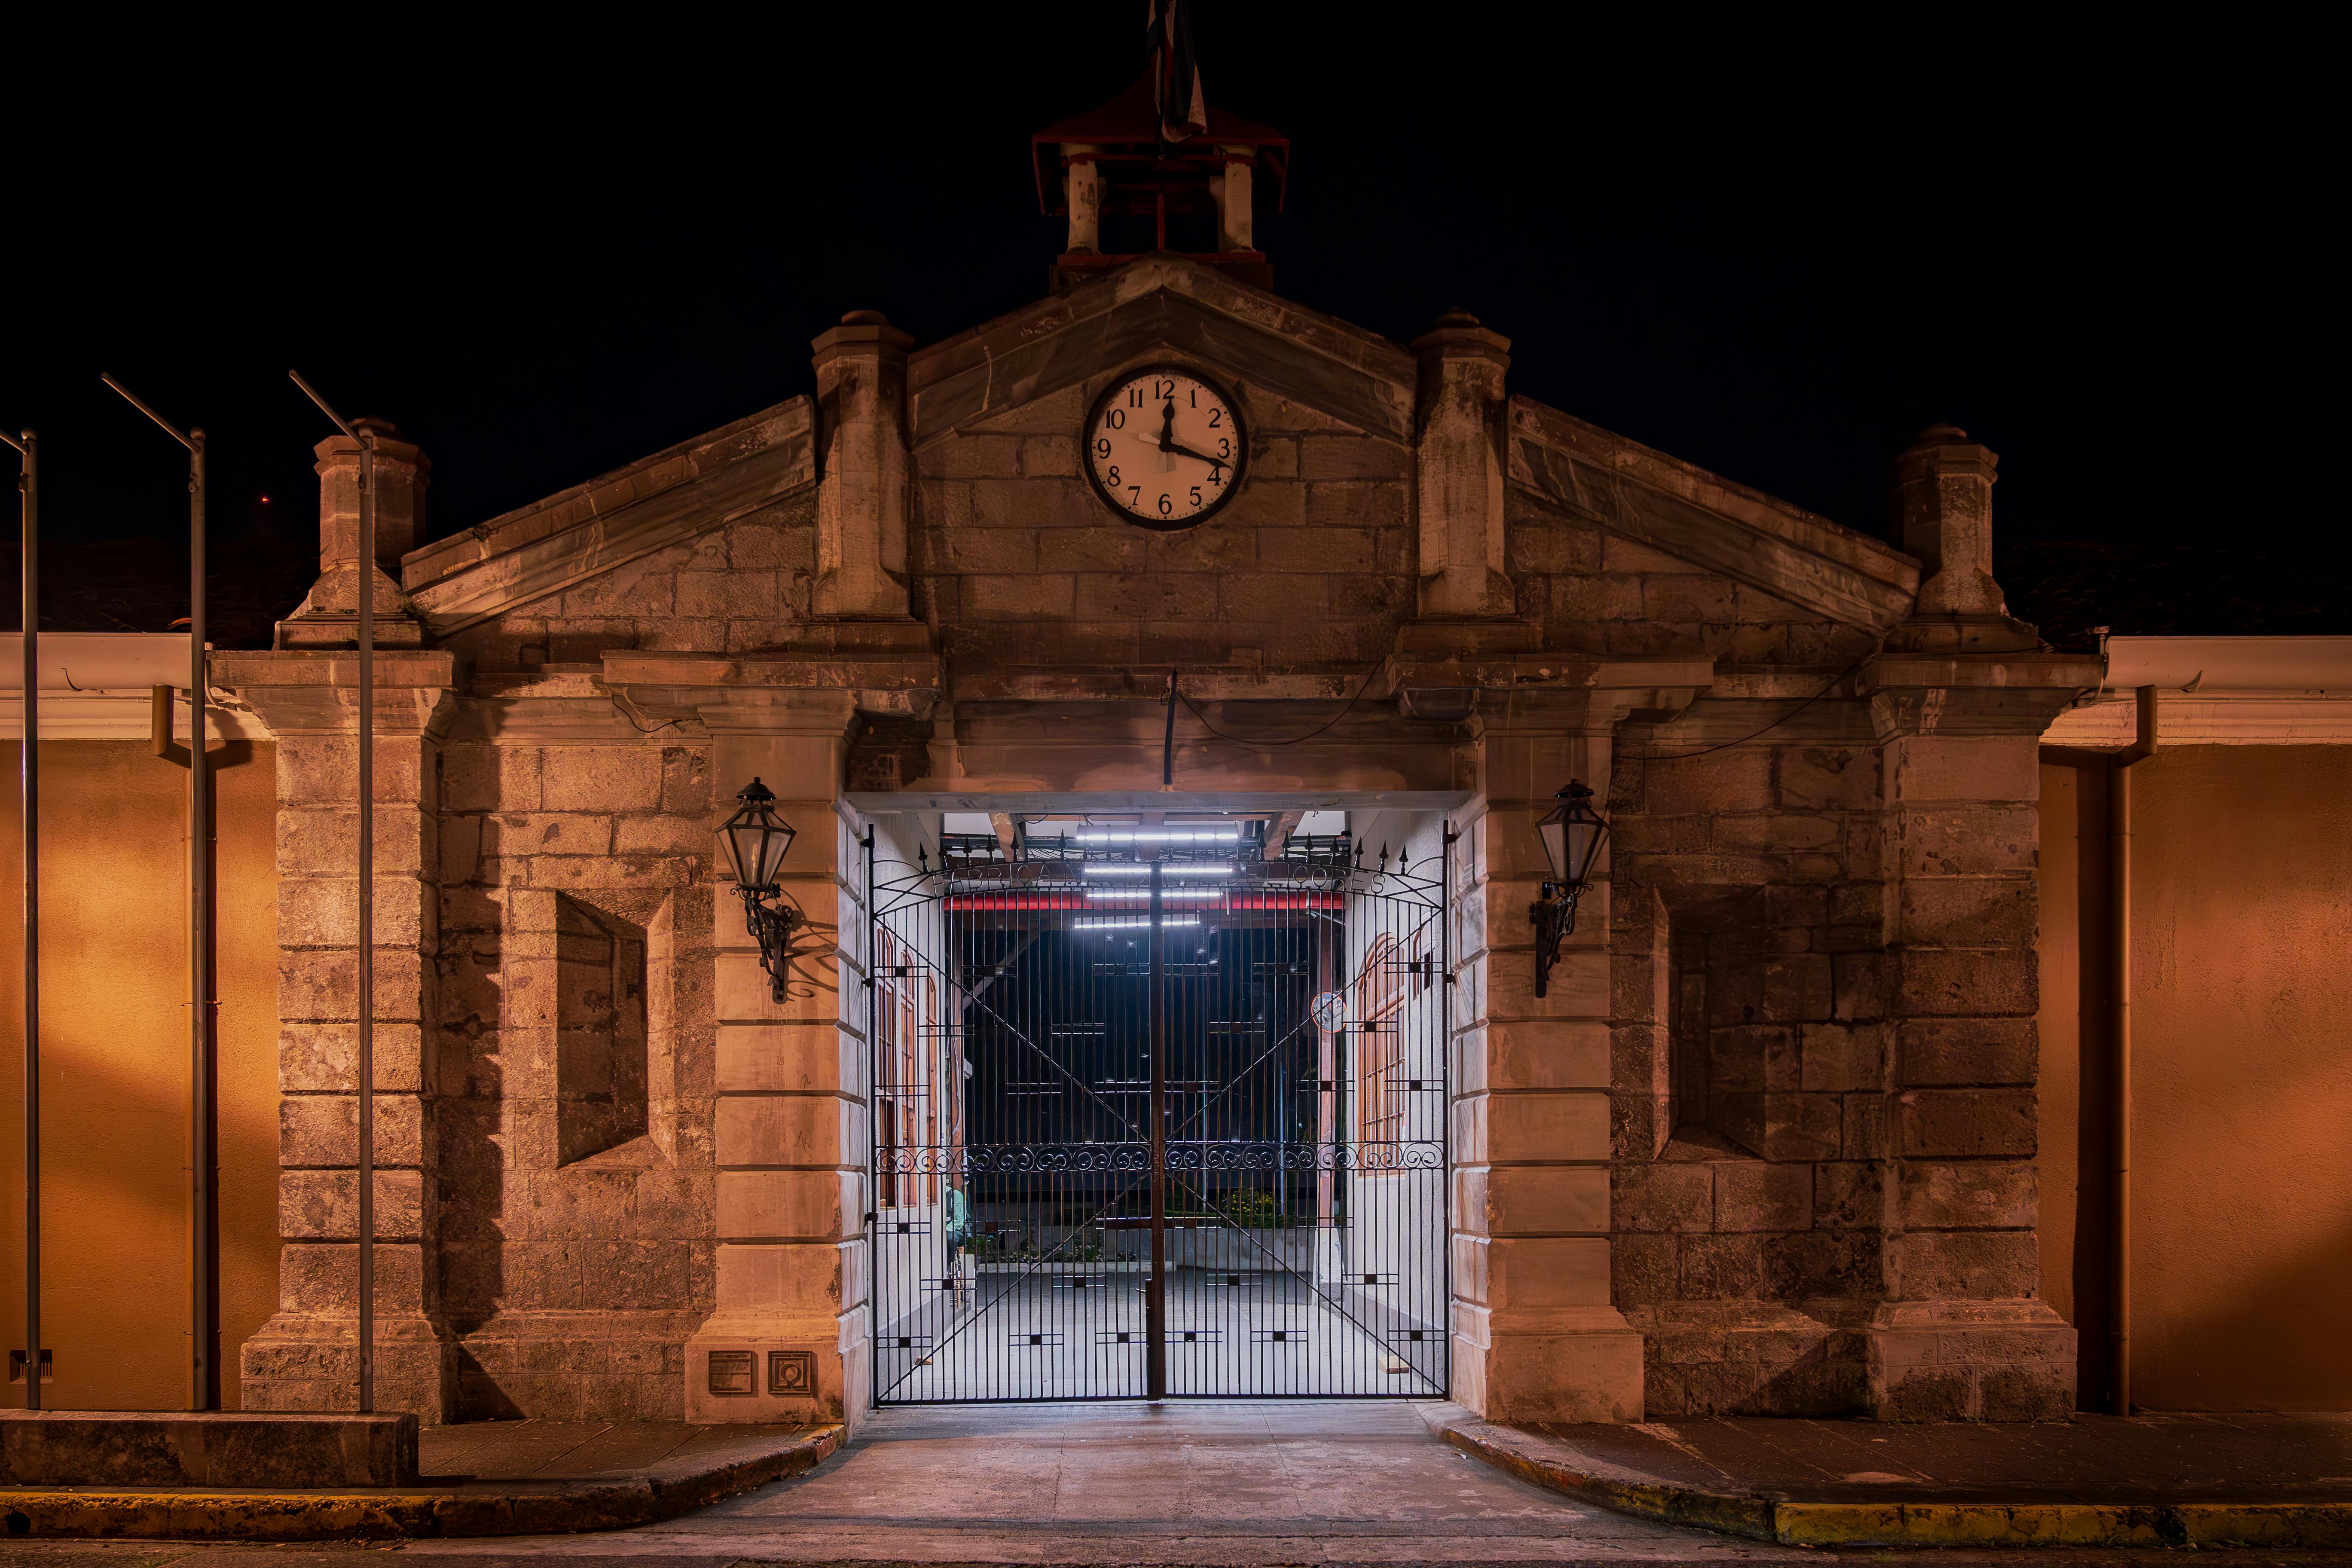 San Jose
Image by:Mario Spencer
San Jose
Image by:Mario Spencer
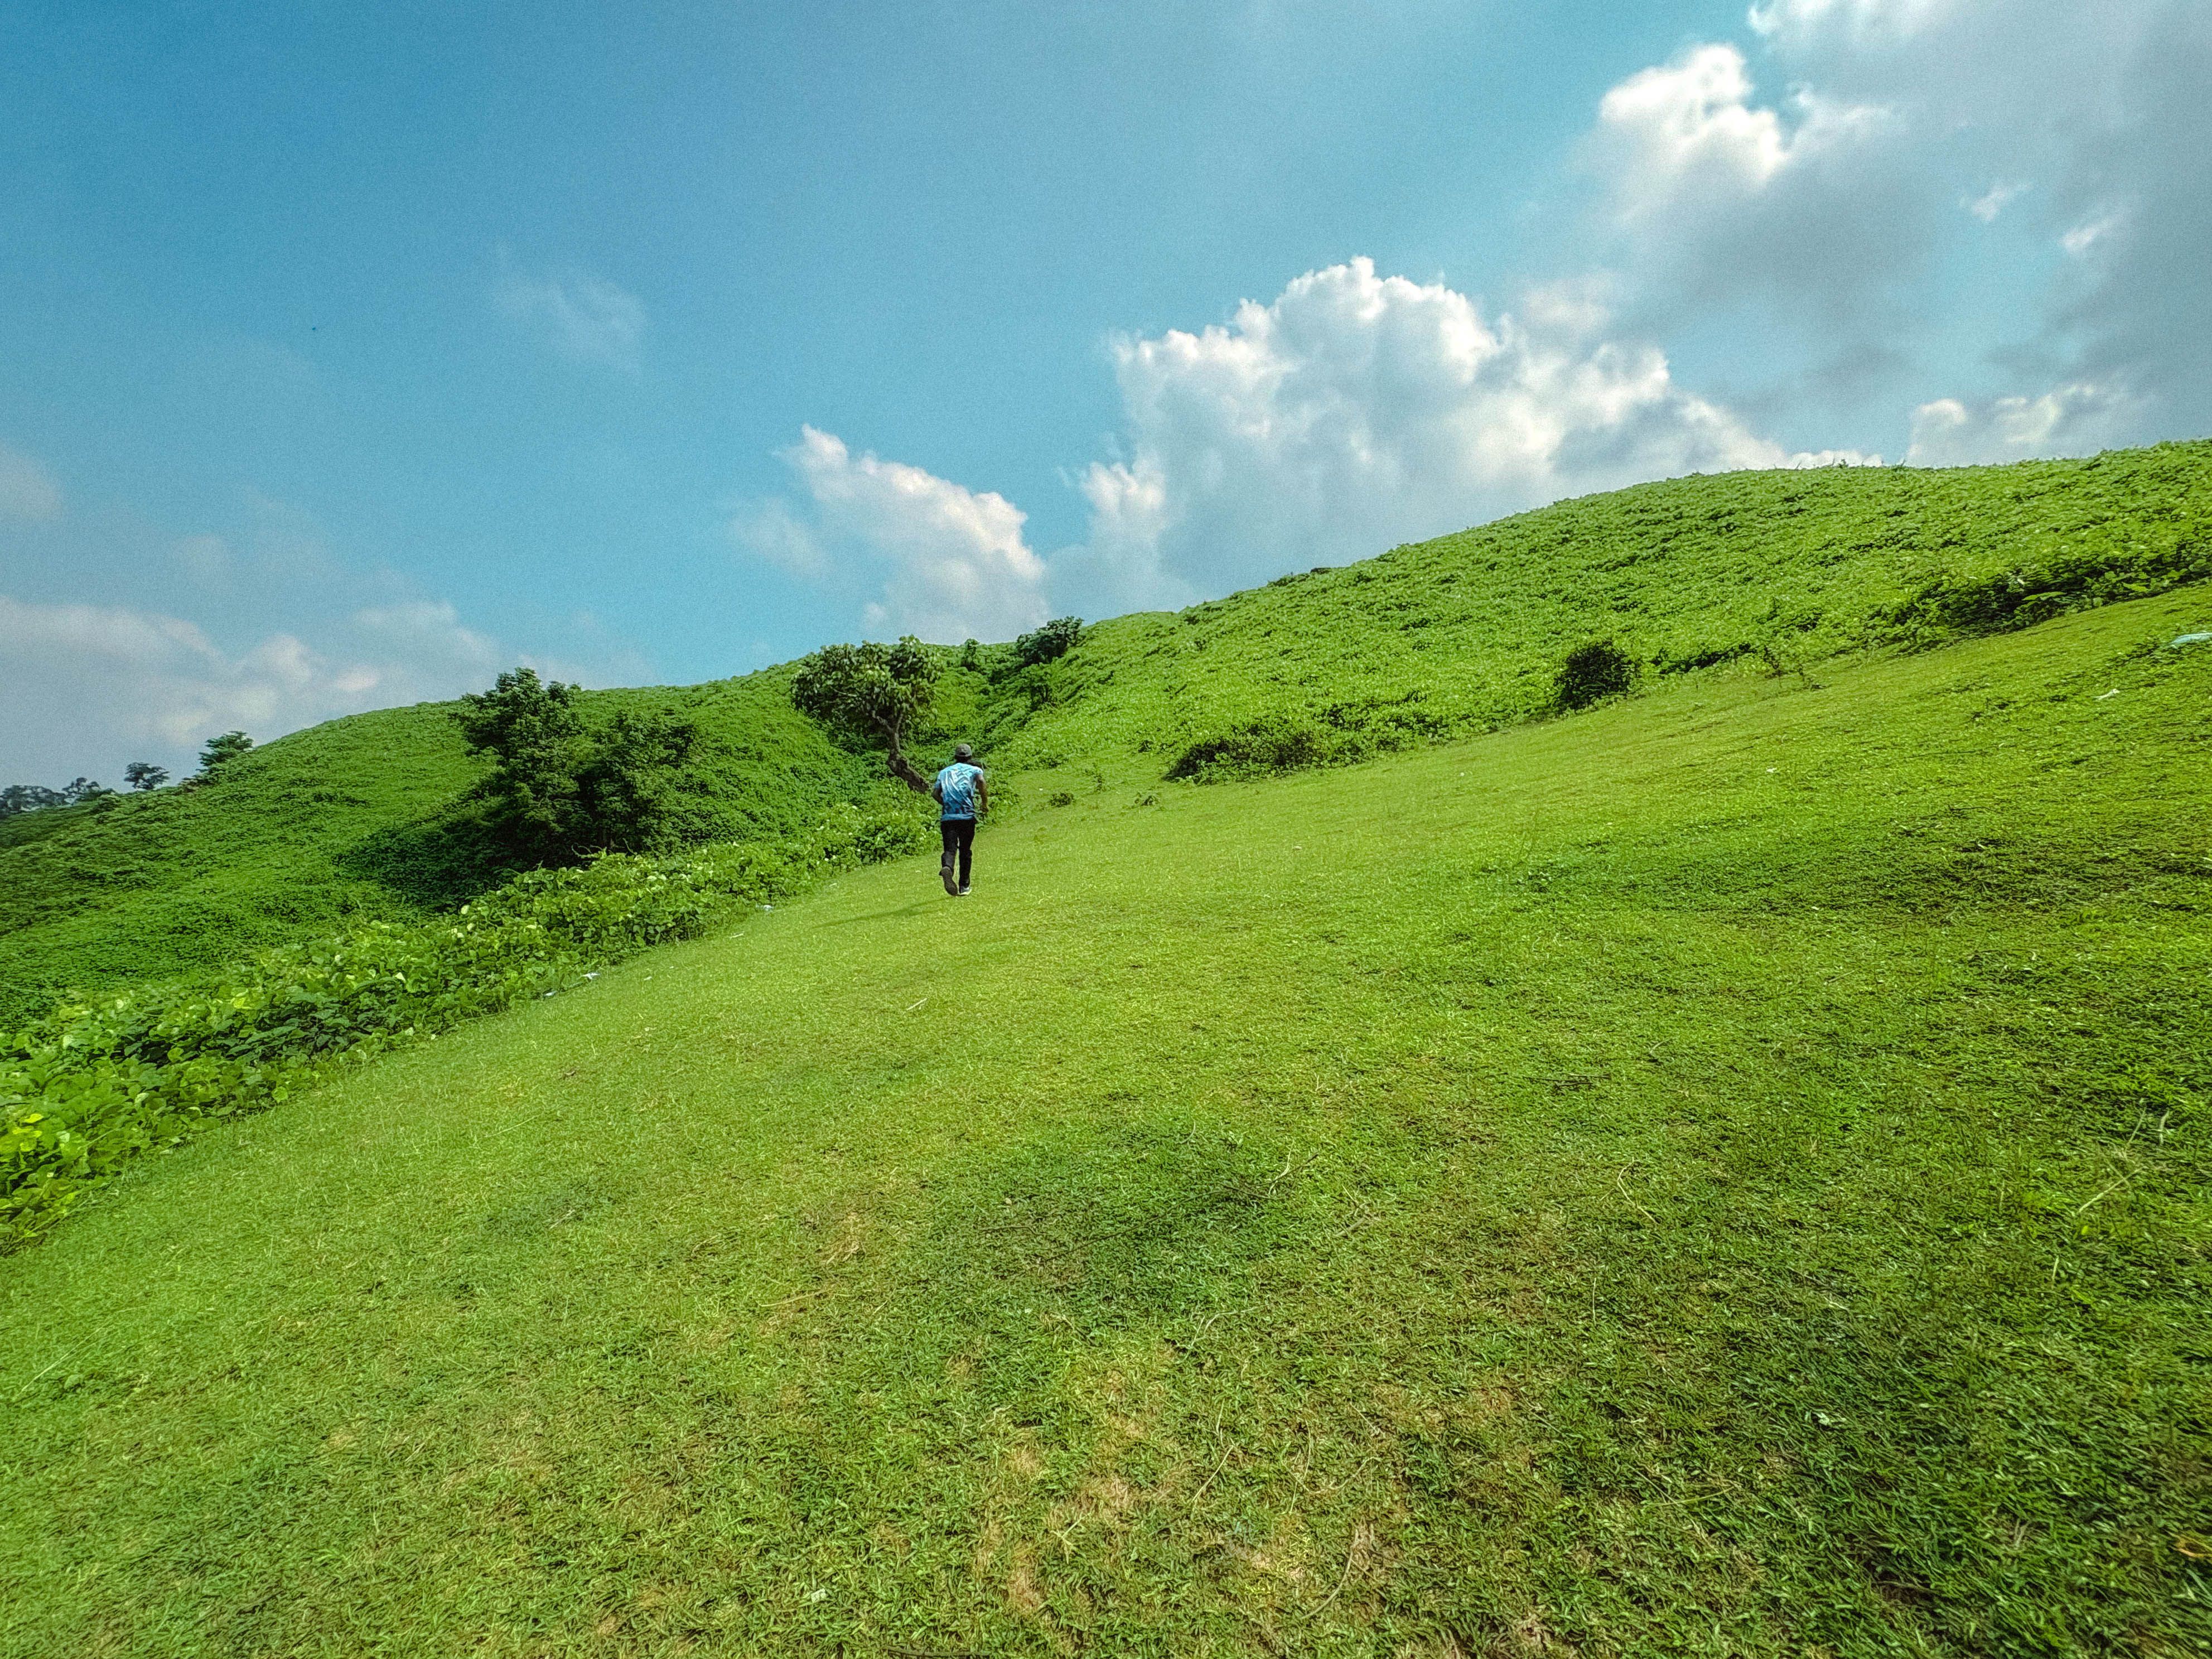 Mymensingh
Image by:Shamim Hossain
Mymensingh
Image by:Shamim Hossain
San José presents a vastly different economic reality compared to Mymensingh. The data for 2026 shows a significant disparity, with the average monthly net salary in San José being approximately $5,639.24, nearly 27 times higher than the $204.35 found in Mymensingh. This economic advantage is mirrored in the city's GDP per capita, which stands at $74,600 versus Mymensingh's $8,200. While housing costs in San José are extremely high, with city-center 1-bedroom apartments priced over $9,245 per square meter, Mymensingh offers remarkably affordable property, with city-center 1-bed apartments at just $430.24 per square meter. Rent reflects this divide sharply, with a 1-bedroom apartment in San José's city center costing nearly $3,163 per month, compared to just $51.66 in Mymensingh's city center. The overall cost of living index for San José is significantly elevated at 212.72, contrasting with Mymensingh's indices, which range from 60.77 to 214.4 depending on the location.
The gap in quality of life between the two cities is equally pronounced. San José scores considerably higher on key metrics. Its Quality of Life Index stands at 173.87, far exceeding the indices found for Mymensingh locations. Crucially, the Safety Index is 52.02, suggesting a lower crime rate or higher perceived safety, while the Health Care Index is 67.96, indicating better access and quality of healthcare services. Other factors like climate perception and commute times also favor San José. Mymensingh, despite its lower costs, lacks comparable data for many quality metrics, but the available indices, particularly the lower end of the range, align with a less developed environment. The disparity in safety, healthcare, and environmental factors underscores the fundamental difference in the lifestyle offered.
For career prospects and investment potential, San José offers a much more robust landscape. The city boasts a significantly higher GDP per capita ($74,600) and lower mortgage interest rates (6.35%) compared to Mymensingh's lower GDP ($8,200) and higher rates (9.0%). While Mymensingh presents a lower barrier to entry with cheaper property and living costs, the much lower salaries ($204.35) combined with the high cost of living, particularly housing, suggest a challenging environment for building wealth or ensuring financial security. Mymensingh's GDP growth rate (5.78%) is higher than San José's (2.89%), but this is dwarfed by the economic gap itself. San José appears as the clear destination for those prioritizing career advancement and a more secure economic base, even if it means accepting the high costs associated with that standard of living.
The comparison between San José and Mymensingh highlights a stark trade-off between cost and quality. San José's exorbitant salaries and high cost of living are matched by superior safety, healthcare, climate perception, and infrastructure, backed by a strong economy. Mymensingh offers drastically lower costs for housing, food, transportation, and utilities, but this comes at the expense of nearly all quality-of-life amenities. While Mymensingh might appeal to those prioritizing extreme budget savings, the significant compromises in safety, health, and overall security represent substantial drawbacks. The decision between these two cities fundamentally depends on whether the financial burden of San José can be managed or if the considerable sacrifices in quality of life and economic security associated with Mymensingh are acceptable.
 San Jose
 Mymensingh
Local cuisine & dishes
San Jose
Mymensingh
 San Jose
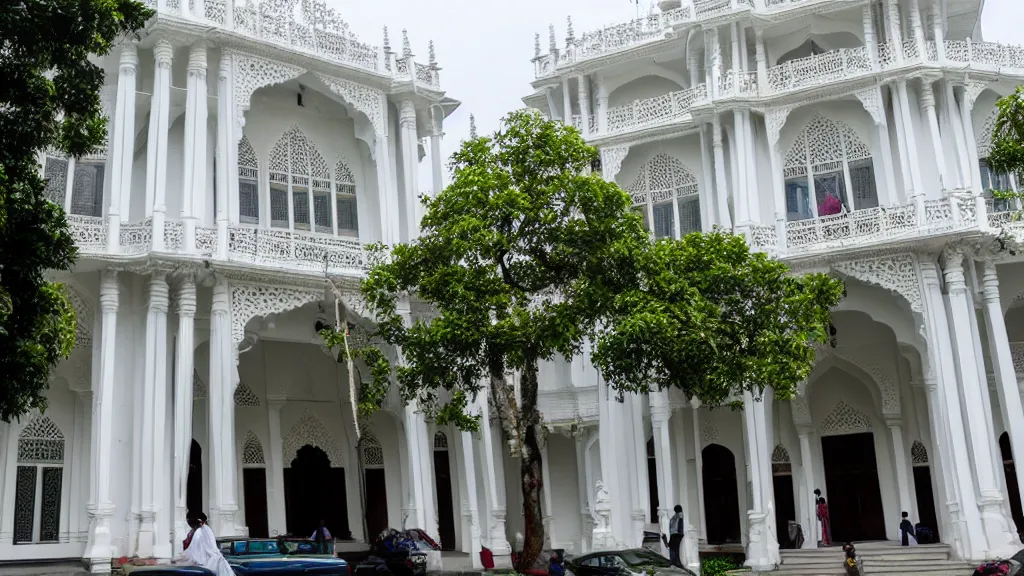 Mymensingh
Travel & attractions
San Jose
Mymensingh
Real estate & living comparison
| San Jose | Mymensingh | |
|---|---|---|
| Price per Square Meter to Buy Apartment in City Centre | 9245.81 USD | 430.24 USD |
| Price per Square Meter to Buy Apartment Outside of Centre | 9746.66 USD | 263.41 USD |
| International Primary School, Annual Tuition per Child | 39800 USD | 2502.21 USD |
| Private Full-Day Preschool or Kindergarten, Monthly Fee per Child | 1849.38 USD | 28.61 USD |
| Jeans (Levi's 501 or Similar) | 56.06 USD | 17.81 USD |
| Men's Leather Business Shoes | 119.91 USD | 31.33 USD |
| Apples (1 kg) | 5.99 USD | 1.88 USD |
| Bananas (1 kg) | 2.15 USD | 0.61 USD |
| 1 Bedroom Apartment in City Centre | 3163.08 USD | 51.66 USD |
| 1 Bedroom Apartment Outside of City Centre | 2724.55 USD | 29.91 USD |
| Bottled Water (0.33 Liter) | 2.55 USD | 0.17 USD |
| Cappuccino (Regular Size) | 5.65 USD | 1.63 USD |
| Annual Mortgage Interest Rate (20-Year Fixed, in %) | 6.35 USD | 9 USD |
| Average Monthly Net Salary (After Tax) | 5639.24 USD | 203.93 USD |
| Cinema Ticket (International Release) | 17.5 USD | 4.09 USD |
| Monthly Fitness Club Membership | 165.83 USD | 8.17 USD |
| Gasoline (1 Liter) | 1.26 USD | 0.96 USD |
| Monthly Public Transport Pass (Regular Price) | 90 USD | 4.9 USD |
| Basic Utilities for 85 m2 Apartment (Electricity, Heating, Cooling, Water, Garbage) | 281.42 USD | 14.3 USD |
| Broadband Internet (Unlimited Data, 60 Mbps or Higher) | 75.48 USD | 12.67 USD |
| Population | 1,543,000 | 576,927 |
Last updated: 2026-04-05T15:43:57+00:00
Comments for this comparison