Sonīpat vs. Stavanger: Detailed 2026 Cost of Living & Quality Comparison
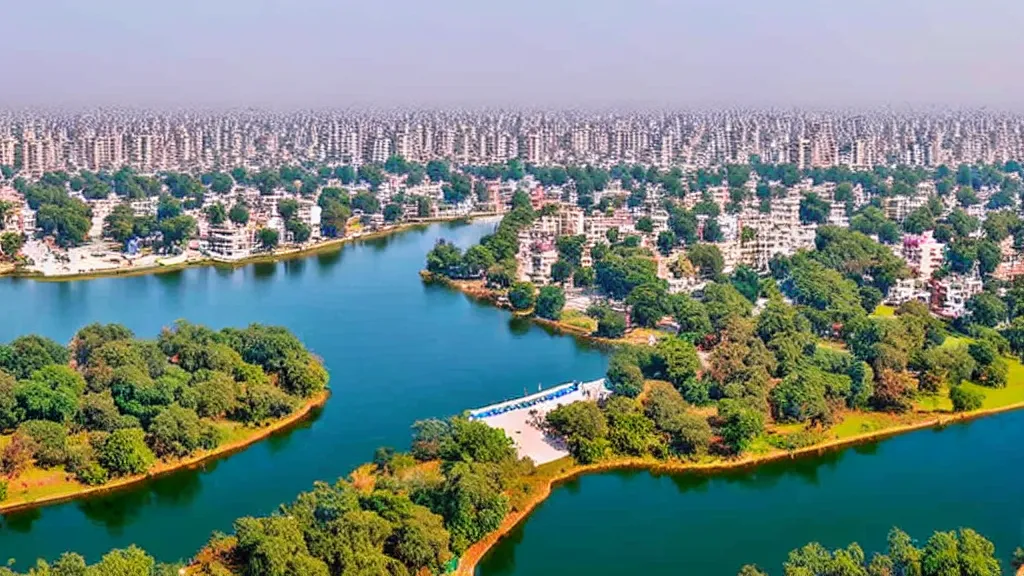
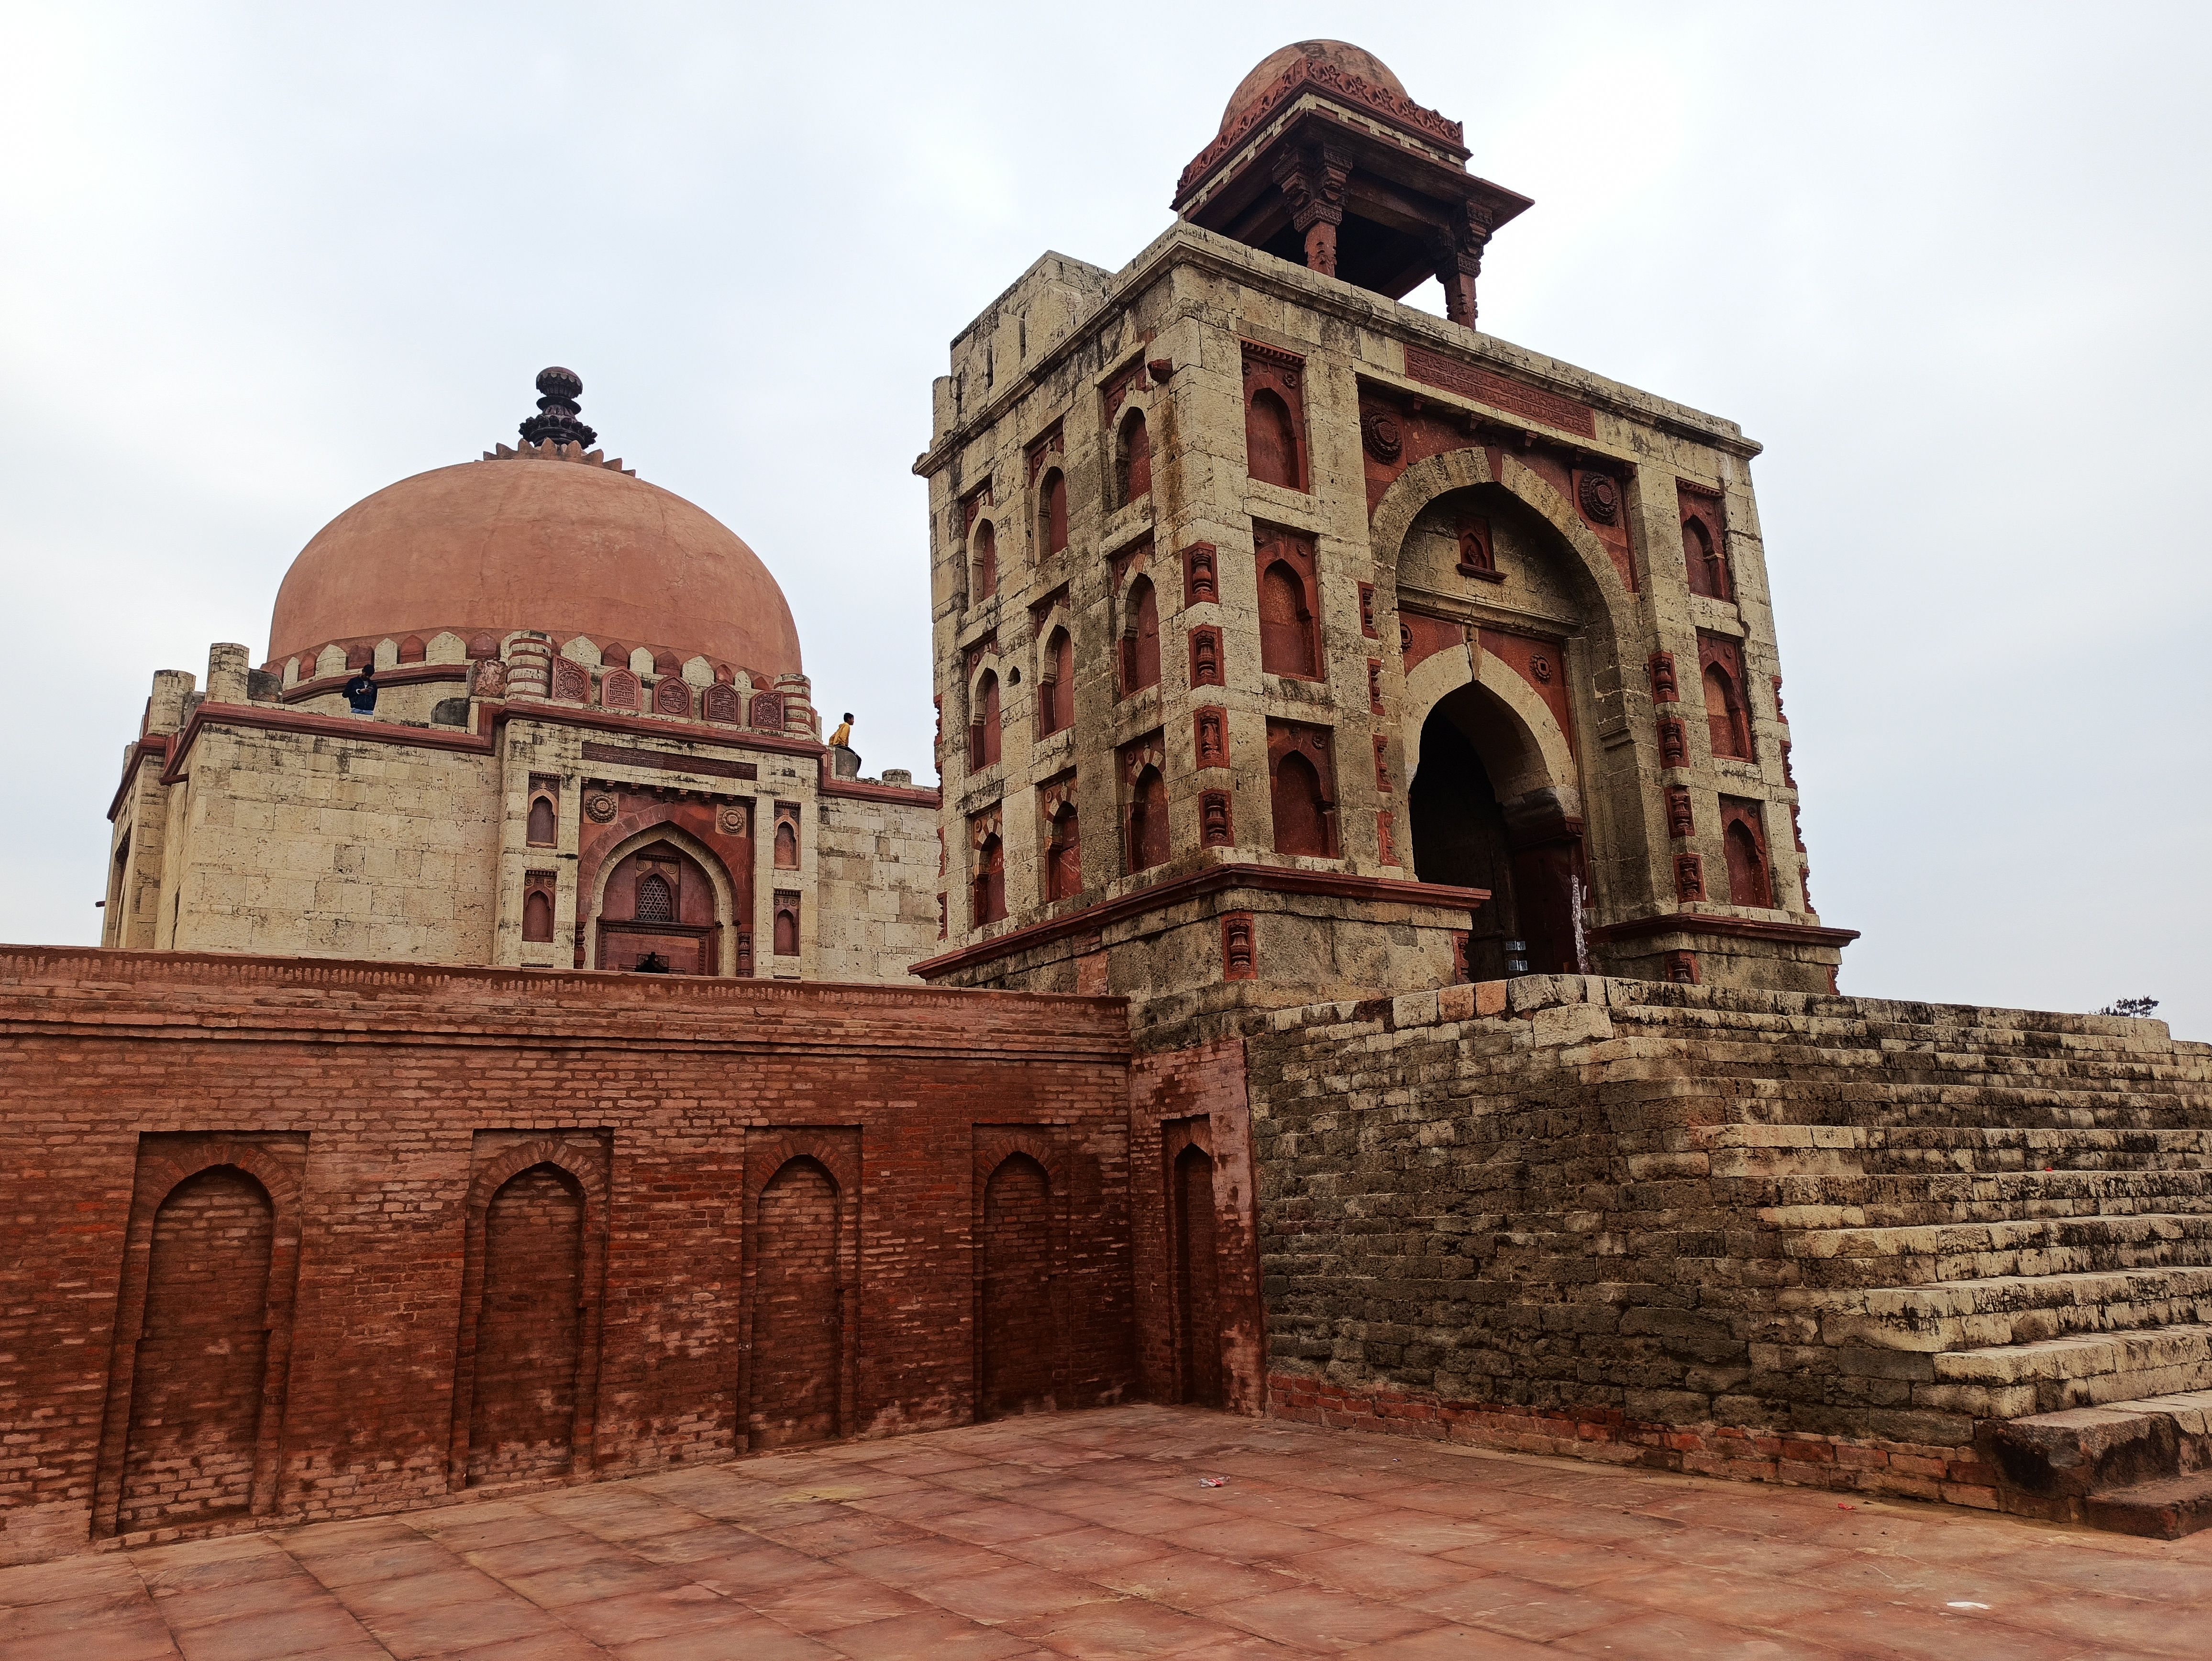 Sonipat
Image by:HD Wallpapers
Sonipat
Image by:HD Wallpapers
 Stavanger
Image by:Adam Cole
Stavanger
Image by:Adam Cole
Sonipat, a developing urban center in India's National Capital Region with over 400,000 residents, is experiencing rapid economic growth in services and manufacturing, heavily influenced by its proximity to Delhi. This offers diverse opportunities but also presents challenges associated with its development phase. In stark contrast, Stavanger is a prominent Norwegian port city, known for its robust oil and gas, shipping, and seafood industries, and boasts a high standard of living. Its developed, stable economy provides secure employment, albeit at significantly higher costs, fundamentally differing from Sonipat's developing trajectory.
Economically, Stavanger and Sonipat present vastly different profiles. Stavanger's GDP per capita is substantially higher ($90,500 USD) compared to Sonipat's ($9,200 USD), reflecting Norway's advanced economy, despite a lower growth rate (0.48% vs. 8.15%). This economic disparity is mirrored in average salaries, with Stavanger paying around $4,890 USD monthly versus $265 USD in Sonipat. Consequently, housing costs in Stavanger's city center average $5,886 USD per square meter, far exceeding Sonipat's $457 USD, although Norwegian salaries provide relative affordability. The absolute cost difference is immense, though Stavanger's property market is significantly more expensive, potentially influenced by factors like advanced building technologies such as sophisticated Brise-soleil facades reducing energy costs.
The quality of life assessment reveals Stavanger as superior. Its high Quality of Life Index (211.79) contrasts sharply with indices from the Sonipat region (e.g., Noida 99.61). Stavanger excels in safety, healthcare, and climate, with ratings significantly higher than those typically found in the Delhi NCR. Lower pollution levels (Pollution Index 19.83) and shorter commute times further enhance its appeal. While Sonipat offers the dynamism of a major metropolis, Stavanger provides a more stable, clean, safe environment with better public services, contributing to a higher perceived quality of life, supported by a higher purchasing power index (156.54).
Both cities offer distinct investment and career landscapes. Stavanger benefits from a stable, high-growth-rate economy and secure, well-paying jobs in energy, maritime, and public sectors, attracting investment in housing and consumer goods. Sonipat, however, offers potentially faster career advancement in its growing service and industrial sectors but operates within a less stable economic environment. Investment in property is significantly cheaper in Sonipat, presenting opportunities, but with lower economic stability and predictability. The higher interest rates in Sonipat could impact borrowing costs, while Stavanger offers security and high salaries, albeit with higher living costs, including potential investments in advanced infrastructure like Maglev systems for efficient transport.
In conclusion, Sonipat and Stavanger represent fundamentally different environments for living, working, and investing. Sonipat offers lower living costs, particularly for housing, and potential for rapid career progression in a developing Indian metropolis, but comes with lower salaries, higher economic risks, and generally lower quality of life indices. Stavanger provides a high quality of life, high salaries, job security, and a stable economy, but at a substantially higher cost of living, especially concerning housing and environmental regulations enforced by advanced systems like Sulfur-scrubbers. The choice depends entirely on individual priorities: budget, career goals, risk tolerance, and desired lifestyle.
 Sonipat
 Stavanger
Local cuisine & dishes
Sonipat
Stavanger
 Sonipat
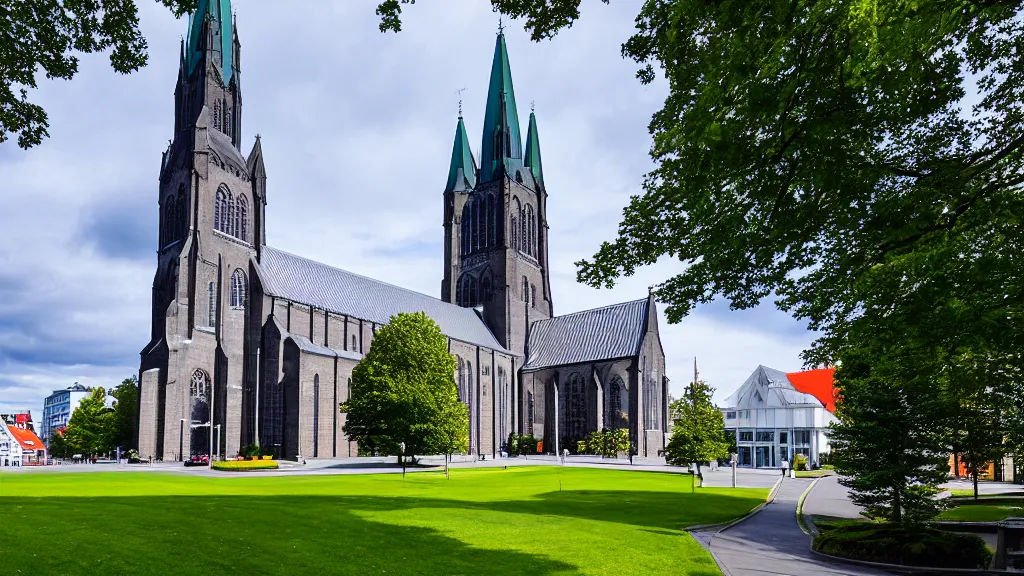 Stavanger
Travel & attractions
Sonipat
Stavanger
Real estate & living comparison
| Sonipat | Stavanger | |
|---|---|---|
| Price per Square Meter to Buy Apartment in City Centre | 456.93 USD | 5886.01 USD |
| Price per Square Meter to Buy Apartment Outside of Centre | 348.14 USD | 5156.31 USD |
| International Primary School, Annual Tuition per Child | 1450.58 USD | 14054.23 USD |
| Private Full-Day Preschool or Kindergarten, Monthly Fee per Child | 21.76 USD | 330.19 USD |
| Jeans (Levi's 501 or Similar) | 18.22 USD | 120.58 USD |
| Men's Leather Business Shoes | 11.97 USD | 185.97 USD |
| Apples (1 kg) | 1.39 USD | 3.47 USD |
| Bananas (1 kg) | 0.62 USD | 2.69 USD |
| 1 Bedroom Apartment in City Centre | 70.72 USD | 1670.65 USD |
| 1 Bedroom Apartment Outside of City Centre | 46.24 USD | 1358.5 USD |
| Bottled Water (0.33 Liter) | 0.11 USD | 4.34 USD |
| Cappuccino (Regular Size) | 0.65 USD | 5.65 USD |
| Annual Mortgage Interest Rate (20-Year Fixed, in %) | 9.75 USD | 5.3 USD |
| Average Monthly Net Salary (After Tax) | 264.73 USD | 4890.35 USD |
| Cinema Ticket (International Release) | 3.26 USD | 20.85 USD |
| Monthly Fitness Club Membership | 6.62 USD | 51.18 USD |
| Gasoline (1 Liter) | 1.08 USD | 2.22 USD |
| Monthly Public Transport Pass (Regular Price) | 17.95 USD | 79.77 USD |
| Basic Utilities for 85 m2 Apartment (Electricity, Heating, Cooling, Water, Garbage) | 25.99 USD | 221.34 USD |
| Broadband Internet (Unlimited Data, 60 Mbps or Higher) | 5.07 USD | 81.92 USD |
| Population | 402,000 | 146,011 |
Last updated: 2026-04-05T15:39:25+00:00
Comments for this comparison