Albuquerque vs. Lancaster: Detailed 2026 Cost of Living & Quality Comparison
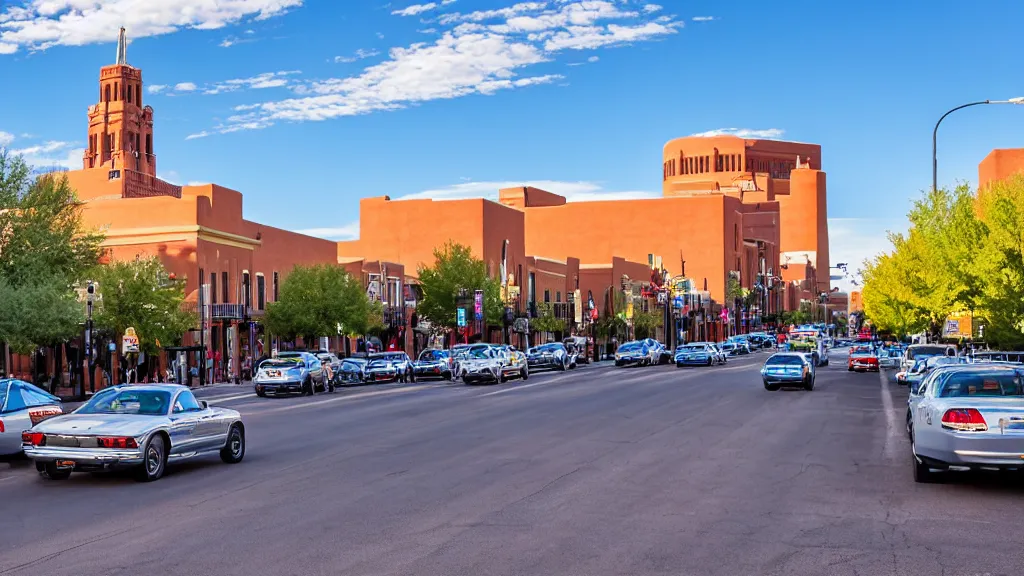
 Albuquerque
Image by:Lad Fury
Albuquerque
Image by:Lad Fury
 Lancaster
Image by:Thomas Beaman
Lancaster
Image by:Thomas Beaman
Albuquerque presents a more economically vibrant picture than Lancaster, evidenced by its larger population base exceeding 767,000 versus Lancaster's 408,000, higher GDP per capita ($74,600 compared to $54,500), and slightly faster population growth (0.67% against 0.45%). This economic scale translates into higher average monthly net salaries for Albuquerque residents ($3,927.89 vs. $2,506.32), suggesting greater individual earning potential. However, this economic advantage comes with a trade-off, as Albuquerque's annual mortgage interest rate (6.16%) is significantly higher than Lancaster's (4.99%), potentially increasing the cost of homeownership for those considering property investment.
The cost of living disparity between Albuquerque and Lancaster is starkly reflected in everyday expenses. Albuquerque generally offers substantially lower prices for groceries, public transportation, utilities, and internet services. Basic food items are notably cheaper, and the cost for an 85m² apartment's utilities and broadband is considerably less. Housing affordability is the most pronounced difference, with Albuquerque's apartment rents being roughly half of Lancaster's city-center rates, and its overall apartment price per square meter significantly lower. While Albuquerque's base costs are higher than Lancaster's, the differential in housing and daily spending is substantial enough to offset much of this difference.
Quality of life metrics favor Albuquerque across several key areas. It scores notably higher on Healthcare (63.38), Climate (67.06), and Quality of Life (180.81), while also registering a lower Pollution Index (40.02). Conversely, Lancaster's Safety Index is considerably higher than Albuquerque's 29.04, although this is inferred from comparing Albuquerque's score against implied safety figures from nearby areas like Preston and Blackpool, which are known to have lower quality of life scores than Albuquerque's. Albuquerque also has a higher commute time index (25.89), suggesting potentially longer journeys to work.
Economic dynamism favors Albuquerque with a higher GDP growth rate (2.89%) compared to Lancaster's (0.34%), indicating potentially faster job market expansion and economic development. This aligns with its higher population growth rate (0.67% vs. 0.45%). However, Lancaster offers lower living costs beyond housing, particularly childcare, where private preschool costs are $1,500/month less ($1,269.35 vs. $2,517.53/year). The lower mortgage rate in Lancaster (4.99%) could make buying a home more affordable, despite its slower economic and population growth rates.
In essence, Albuquerque and Lancaster cater to fundamentally different priorities. Albuquerque offers higher salaries and a higher quality of life in healthcare, climate, and livability, but demands significantly more for housing, groceries, transportation, and faces a lower safety index. Lancaster provides lower living costs, including childcare and potentially lower housing expenses, alongside a lower mortgage rate, but comes with lower salaries, a lower GDP, and generally lower quality of life metrics, alongside slower economic prospects. The choice between these cities depends entirely on whether an individual prioritizes higher earnings and potentially better quality-of-life fundamentals, or lower living expenses and a lower cost of borrowing, accepting slower economic growth.
 Albuquerque
 Lancaster
Local cuisine & dishes
Albuquerque
Lancaster
 Albuquerque
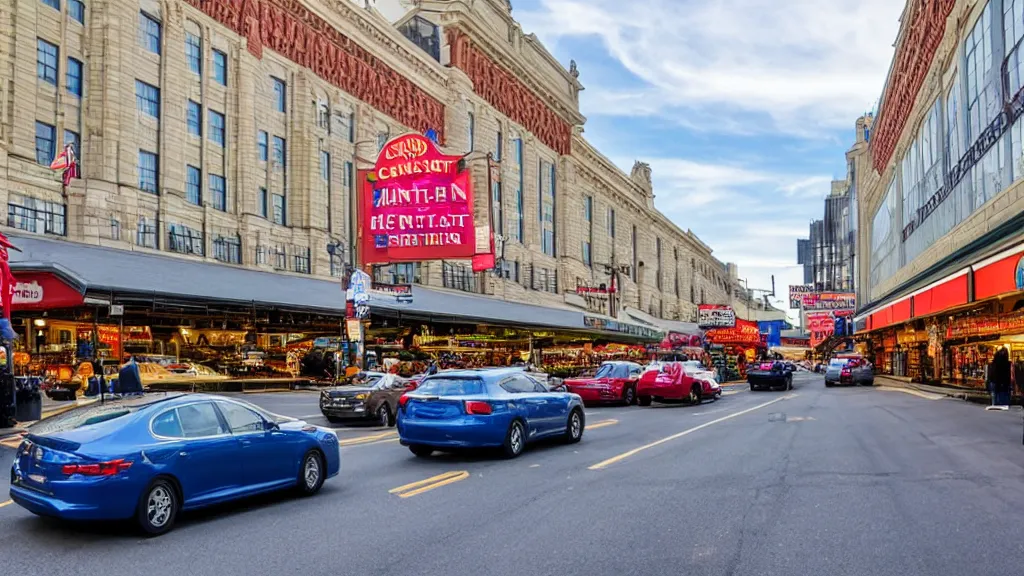 Lancaster
Travel & attractions
Albuquerque
Lancaster
Real estate & living comparison
| Albuquerque | Lancaster | |
|---|---|---|
| Price per Square Meter to Buy Apartment in City Centre | 2495.21 USD | 5177.59 USD |
| Price per Square Meter to Buy Apartment Outside of Centre | 2240.94 USD | 9353.07 USD |
| International Primary School, Annual Tuition per Child | 25175.33 USD | 22204.73 USD |
| Private Full-Day Preschool or Kindergarten, Monthly Fee per Child | 1500 USD | 1269.35 USD |
| Jeans (Levi's 501 or Similar) | 54.31 USD | 85.96 USD |
| Men's Leather Business Shoes | 118.44 USD | 40.08 USD |
| Apples (1 kg) | 4.84 USD | 3.21 USD |
| Bananas (1 kg) | 1.53 USD | 1.96 USD |
| 1 Bedroom Apartment in City Centre | 1268.9 USD | 1068.92 USD |
| 1 Bedroom Apartment Outside of City Centre | 1073.17 USD | 801.69 USD |
| Bottled Water (0.33 Liter) | 2.21 USD | 2.06 USD |
| Cappuccino (Regular Size) | 5.21 USD | 4.33 USD |
| Annual Mortgage Interest Rate (20-Year Fixed, in %) | 6.16 USD | 5.64 USD |
| Average Monthly Net Salary (After Tax) | 3927.89 USD | 2506.32 USD |
| Cinema Ticket (International Release) | 13.25 USD | 8.35 USD |
| Monthly Fitness Club Membership | 45 USD | 56.92 USD |
| Gasoline (1 Liter) | 0.78 USD | 1.82 USD |
| Monthly Public Transport Pass (Regular Price) | 4 USD | 66.81 USD |
| Basic Utilities for 85 m2 Apartment (Electricity, Heating, Cooling, Water, Garbage) | 167.78 USD | 294.77 USD |
| Broadband Internet (Unlimited Data, 60 Mbps or Higher) | 69.47 USD | 42.45 USD |
| Population | 767,499 | 408,023 |
Last updated: 2026-04-05T17:40:03+00:00
More city comparisons
From United States
- Duluth vs Lapu-Lapu City
- Yakima vs Sabratah
- Reading vs Springfield
- Beirut vs Mesa
- San Bernardino vs Jamnagar
- Naperville vs Rajshahi
- Kadoma vs Miami
- Suzhou vs Atlanta
- Odessa vs Herat
- Chicago vs Venice
- Orlando vs Liberec
- Chongqing vs Los Angeles
- Oslo vs Oklahoma City
- Coimbra vs Seattle
- Kuantan vs College Station
- Ome vs Brandon
- Pietermaritzburg vs Green Bay
- Tumkur vs Odessa
- New York vs Cairo
- Seattle vs Hangzhou
Comments for this comparison