Ayacucho vs. Uyo: Detailed 2026 Cost of Living & Quality Comparison
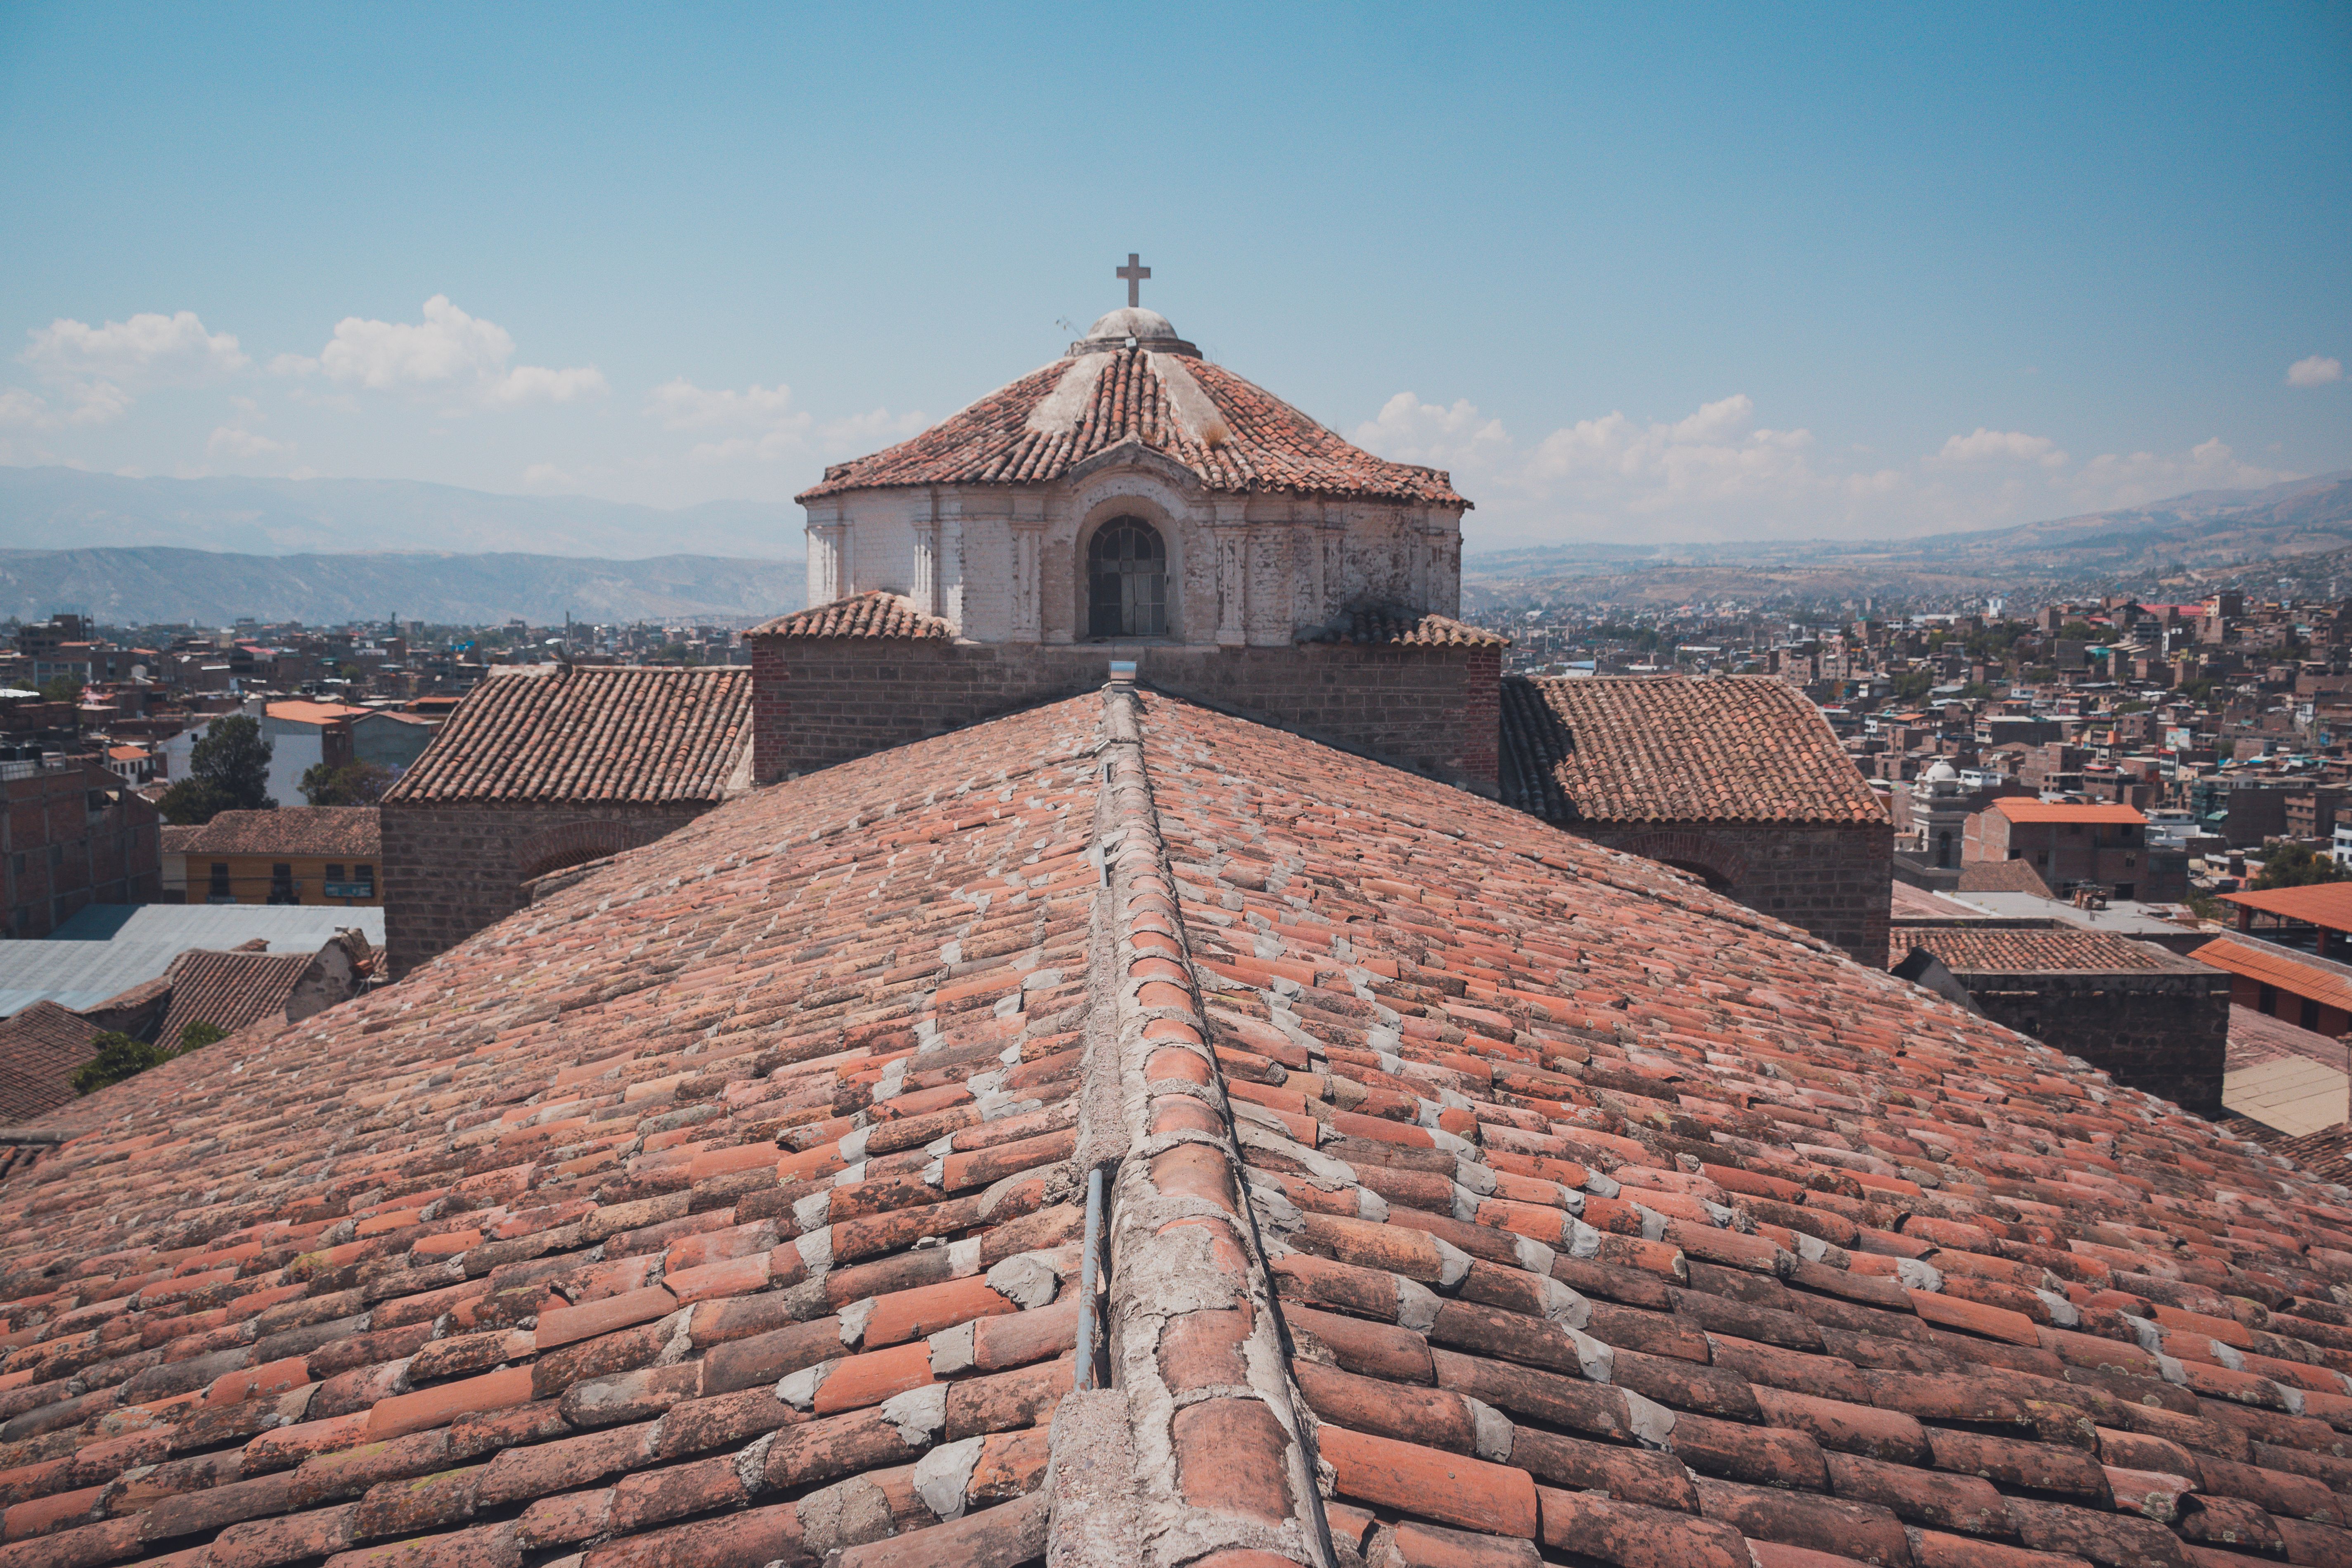 Ayacucho
Image by:Gilmer Diaz Estela
Ayacucho
Image by:Gilmer Diaz Estela
 Uyo
Image by:Ogonna Sylvester Ogbu
Uyo
Image by:Ogonna Sylvester Ogbu
Ayacucho and Uyo represent vastly different economic landscapes in 2026, fundamentally shaping the cost of living for their residents. Ayacucho boasts a significantly higher GDP per capita compared to Uyo, suggesting a more developed regional economy. However, Uyo's economy, while smaller in per capita terms, shows signs of dynamism with a higher GDP growth rate, indicating faster expansion. Crucially, despite Ayacucho's higher base economic output, the average net salary is substantially lower, reflecting different economic structures or wage levels. This economic disparity directly impacts affordability, setting the stage for stark differences in living expenses between the two cities.
The housing market starkly illustrates the economic gap. Ayacucho commands premium prices for property, particularly in the city center, reflecting its higher status and economic profile. Uyo's housing market, conversely, appears significantly more accessible, likely due to its lower GDP per capita and different cost structures. This disparity extends beyond just property; Ayacucho is considerably more expensive for everyday living, from groceries to dining out, creating a substantial cost-of-living gap that favors Uyo's affordability for most basic needs.
While specific data on safety and healthcare access is limited, the pronounced differences in basic cost-of-living expenses strongly suggest divergent quality-of-life experiences. The much lower prices for food, beverages, and housing in Uyo translate into significantly more purchasing power for daily goods and services. This affordability, coupled with potentially lower average earnings, paints a picture of a city offering a distinct, more budget-conscious lifestyle compared to Ayacucho, where the higher costs for essentials represent a significant financial burden.
For those considering investment or career opportunities, the data points towards different priorities. Ayacucho's higher GDP per capita might suggest greater infrastructure development, but its lower economic growth rate and significantly lower average net salary indicate potentially less dynamism and lower earning potential for professionals. Uyo, despite its lower GDP per capita, demonstrates a higher economic growth rate and a higher population growth rate, suggesting a potentially more vibrant market for investment and business expansion. The choice, therefore, hinges on weighing the potential for higher income and development against the lower base economic indicators and faster growth in Uyo.
Ultimately, the decision between Ayacucho and Uyo rests on conflicting priorities revealed by the 2026 data. Ayacucho offers a higher GDP per capita and potentially more established infrastructure, but comes with significantly higher costs for food, housing, and other essentials, coupled with lower average salaries. Uyo presents a much lower cost of living and potentially faster economic growth, but with a lower GDP per capita and likely lower average earnings. The path chosen depends entirely on whether an individual prioritizes the higher economic base and potential infrastructure of Ayacucho, accepting its financial demands, or values the substantial affordability and growth potential of Uyo.
 Ayacucho
 Uyo
UyoLocal cuisine & dishes
Ayacucho
Uyo
 Ayacucho
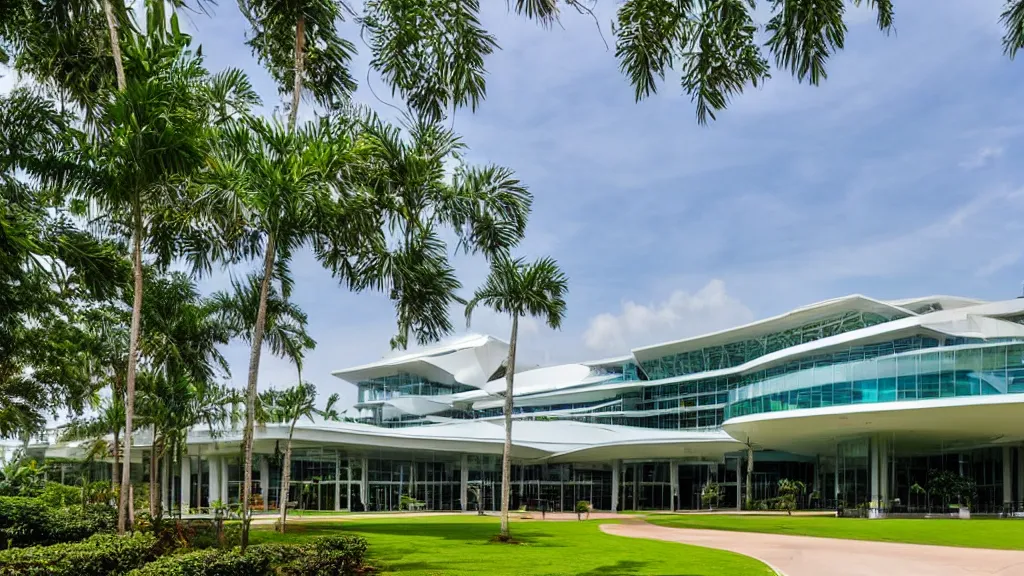 Uyo
UyoTravel & attractions
Ayacucho
Uyo
Real estate & living comparison
| Ayacucho | Uyo | |
|---|---|---|
| Bottled Water (0.33 Liter) | 0.3 USD | 0.2 USD |
| Combo Meal at McDonald's (or Equivalent Fast-Food Meal) | 4.46 USD | 2.5 USD |
| GDP Growth Rate: | 0.55 USD | 2.86 USD |
| GDP Per Capita ($) : | 15300 USD | 5600 USD |
| Monthly Fitness Club Membership | 26.75 USD | 25.3 USD |
| Population | 216,444 | 554,906 |
Last updated: 2026-04-05T11:46:43+00:00
Comments for this comparison