Catabola vs. San Juan: Detailed 2026 Cost of Living & Quality Comparison
 Catabola
Image by:Dm Photography DM
Catabola
Image by:Dm Photography DM
 San Juan
Image by:Abel Acosta
San Juan
Image by:Abel Acosta
The economic landscape between Catabola and San Juan presents a stark contrast, making direct comparisons challenging. San Juan benefits from clearer economic indicators, including a GDP per capita of $43,000 and a GDP growth rate of 0.56%, suggesting a more developed and stable economy. Average monthly net salaries in comparable areas are around $2,616.87, providing a benchmark for income levels. In contrast, Catabola's economic data is notably sparse and potentially inconsistent. The absence of GDP figures or salary data, coupled with property prices that seem numerically scaled differently from standard economic metrics, hinders a reliable assessment of its economic standing or income levels in 2026.
Housing costs offer another area where the two cities diverge significantly, particularly concerning data reliability. San Juan provides quantifiable rental and purchase prices. A 1-bedroom apartment rents for between $813 and $1,809 per month, while property prices range from $3,379 to $7,408 per square meter, depending on location. This data allows for a clearer understanding of the housing market. Catabola's property prices, while listed, appear numerically inconsistent with standard cost of living and quality of life metrics, making it difficult to gauge the true cost burden or market dynamics accurately.
Quality of life metrics also reveal significant differences, though Catabola's data raises serious concerns about standardization and reliability. San Juan offers specific indices: a Safety Index of 33.16 (lower is better) and a Health Care Index of 63.06. It also details essential service costs, such as $87.52 per month for kindergarten childcare and $12,862.92 per year for primary school, alongside $70.37 per month for broadband. These figures provide a more conventional picture of daily living expenses and safety/health. Conversely, Catabola's quality of life scores are extraordinarily high and lack standardization, rendering direct comparison nearly impossible and suggesting potential data anomalies.
Investment potential and career prospects are largely undefined for Catabola, unlike the more transparent situation in San Juan. While property investment data exists for Catabola, it is numerically scaled differently and lacks context regarding economic stability or return potential. Career data is entirely absent, leaving any assessment of job opportunities or salary levels speculative. In San Juan, however, investment in real estate is quantifiable, with a property price-to-income ratio of 10.3 indicating a potentially significant financial burden for housing, and a mortgage interest rate of 6.42% providing a concrete investment cost, albeit alongside a salary that necessitates careful budgeting.
Ultimately, the available data strongly favors San Juan for reliable analysis and decision-making. It offers a more complete and interpretable dataset, reflecting a defined economy, measurable quality of life factors, quantifiable costs, and definable housing and investment metrics. While the cost of living is substantial, it is presented on a more standard scale. Catabola, conversely, presents a fundamentally different and highly problematic picture. Its quality of life and cost of living data points are exceptionally high and lack standardization, making direct comparison difficult and potentially indicating data issues. The sparse economic data and numerically inconsistent investment metrics further hinder a reliable assessment of its living conditions and economic opportunities in 2026.
 Catabola
 San Juan
Local cuisine & dishes
Catabola
San Juan
 Catabola
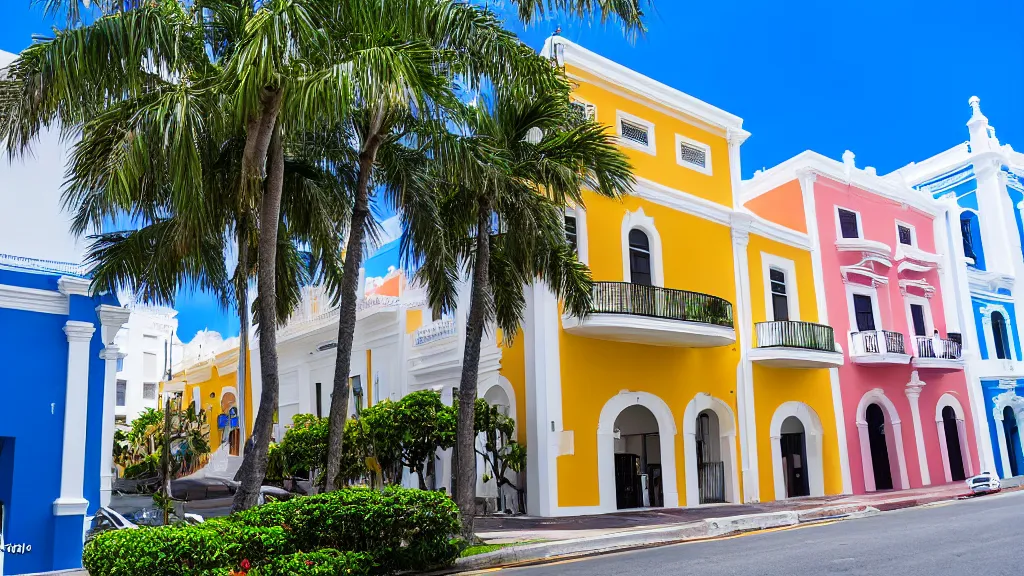 San Juan
Travel & attractions
Catabola
San Juan
Real estate & living comparison
| Catabola | San Juan | |
|---|---|---|
| Population | 126,631 | 132,177 |
Last updated: 2026-04-05T15:34:42+00:00
Comments for this comparison