Gitega vs. Kwekwe: Detailed 2026 Cost of Living & Quality Comparison
 Gitega
Image by:Peace Alberto Iteriteka
Gitega
Image by:Peace Alberto Iteriteka
 Kwekwe
Image by:Noah Denhe
Kwekwe
Image by:Noah Denhe
Gitega and Kwekwe present fundamentally different profiles for analysis, largely due to the disparity in available data. Gitega's figures offer city-wide metrics for cost of living and quality of life, but lack the granular detail seen in Kwekwe. Kwekwe provides specific data across numerous cost-of-living categories and key economic indicators, painting a much clearer, albeit potentially more complex, picture. This difference isn't just about averages; it's about understanding the nuances of daily expenses and economic opportunities, areas where Kwekwe's data provides significantly more transparency.
Economically, the data reveals stark contrasts, though Kwekwe's figures are more readily available. Kwekwe's average monthly net salary stands at $300, a fraction of its GDP per capita of $3,400, hinting at potential income inequality or significant informal economic activity. Property costs in Kwekwe range from relatively affordable one-bedroom apartments ($150-$201 per month) to more substantial three-bedroom units ($600-$800). Gitega lacks comparable detailed economic data, making a direct comparison challenging, despite its city-level figures suggesting lower overall costs than Kwekwe for similar metrics.
The quality of life comparison underscores the data gap even further. Kwekwe's quality of life scores, varying wildly from 15.49 to 201.16 across different districts, indicate dramatic differences in living standards, amenities, and likely safety and healthcare access depending on location. This level of detail is absent for Gitega, which provides only a single city-wide figure. While this figure appears higher than the lowest Kwekwe score, its lack of context makes it impossible to gauge the actual living conditions accurately or compare meaningfully to the best areas in Kwekwe.
Assessing investment and career prospects is also hampered by Gitega's data paucity. Kwekwe offers tangible metrics like GDP growth (5.34%) and population growth (1.91%), alongside salary benchmarks, providing a basis for evaluating economic health and potential opportunities. Gitega offers no such comparable figures, leaving its investment climate and job market dynamics shrouded in uncertainty. Kwekwe's data suggests a developing economy, while Gitega's absence of information makes any assessment of its career environment speculative at best.
Ultimately, the data landscape favors Kwekwe for a comprehensive analysis. Its detailed breakdowns allow for a nuanced understanding of cost of living, property markets, and quality of life variations. Gitega's city-wide metrics, while appearing lower for certain categories, cannot be fully evaluated due to the lack of breakdowns and the absence of detailed economic indicators. Kwekwe offers a clearer, if sometimes more complex, picture of its living and working environment, whereas Gitega remains largely obscured by data limitations.
 Gitega
 Kwekwe
Local cuisine & dishes
Gitega
Kwekwe
 Gitega
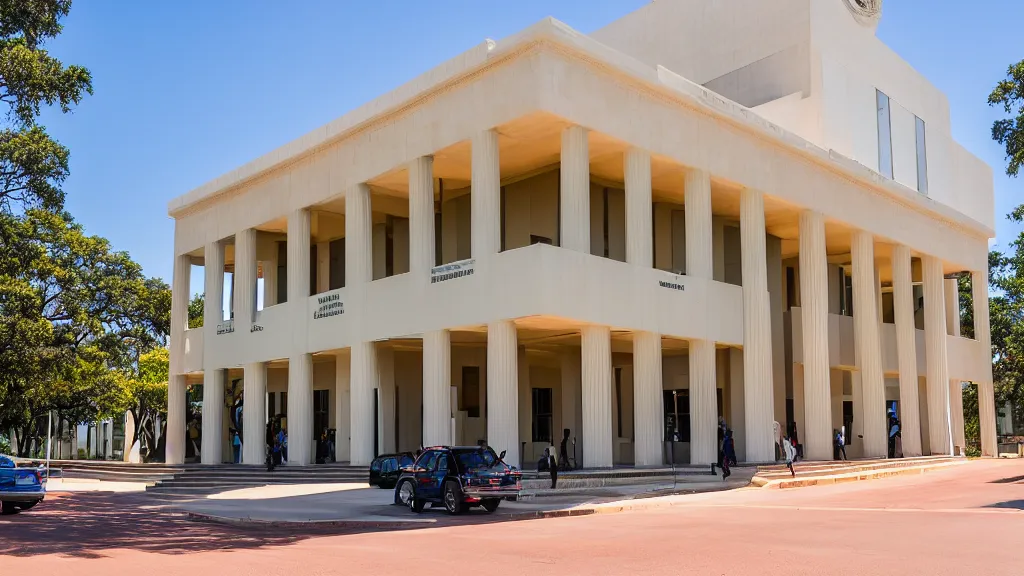 Kwekwe
Travel & attractions
Gitega
Kwekwe
Real estate & living comparison
| Gitega | Kwekwe | |
|---|---|---|
| Population | 135,467 | 119,863 |
Last updated: 2026-04-05T11:46:45+00:00
Comments for this comparison