Jalna vs. Hobart: Detailed 2026 Cost of Living & Quality Comparison
 Jalna
Image by:Vijit Bagh,,
Jalna
Image by:Vijit Bagh,,
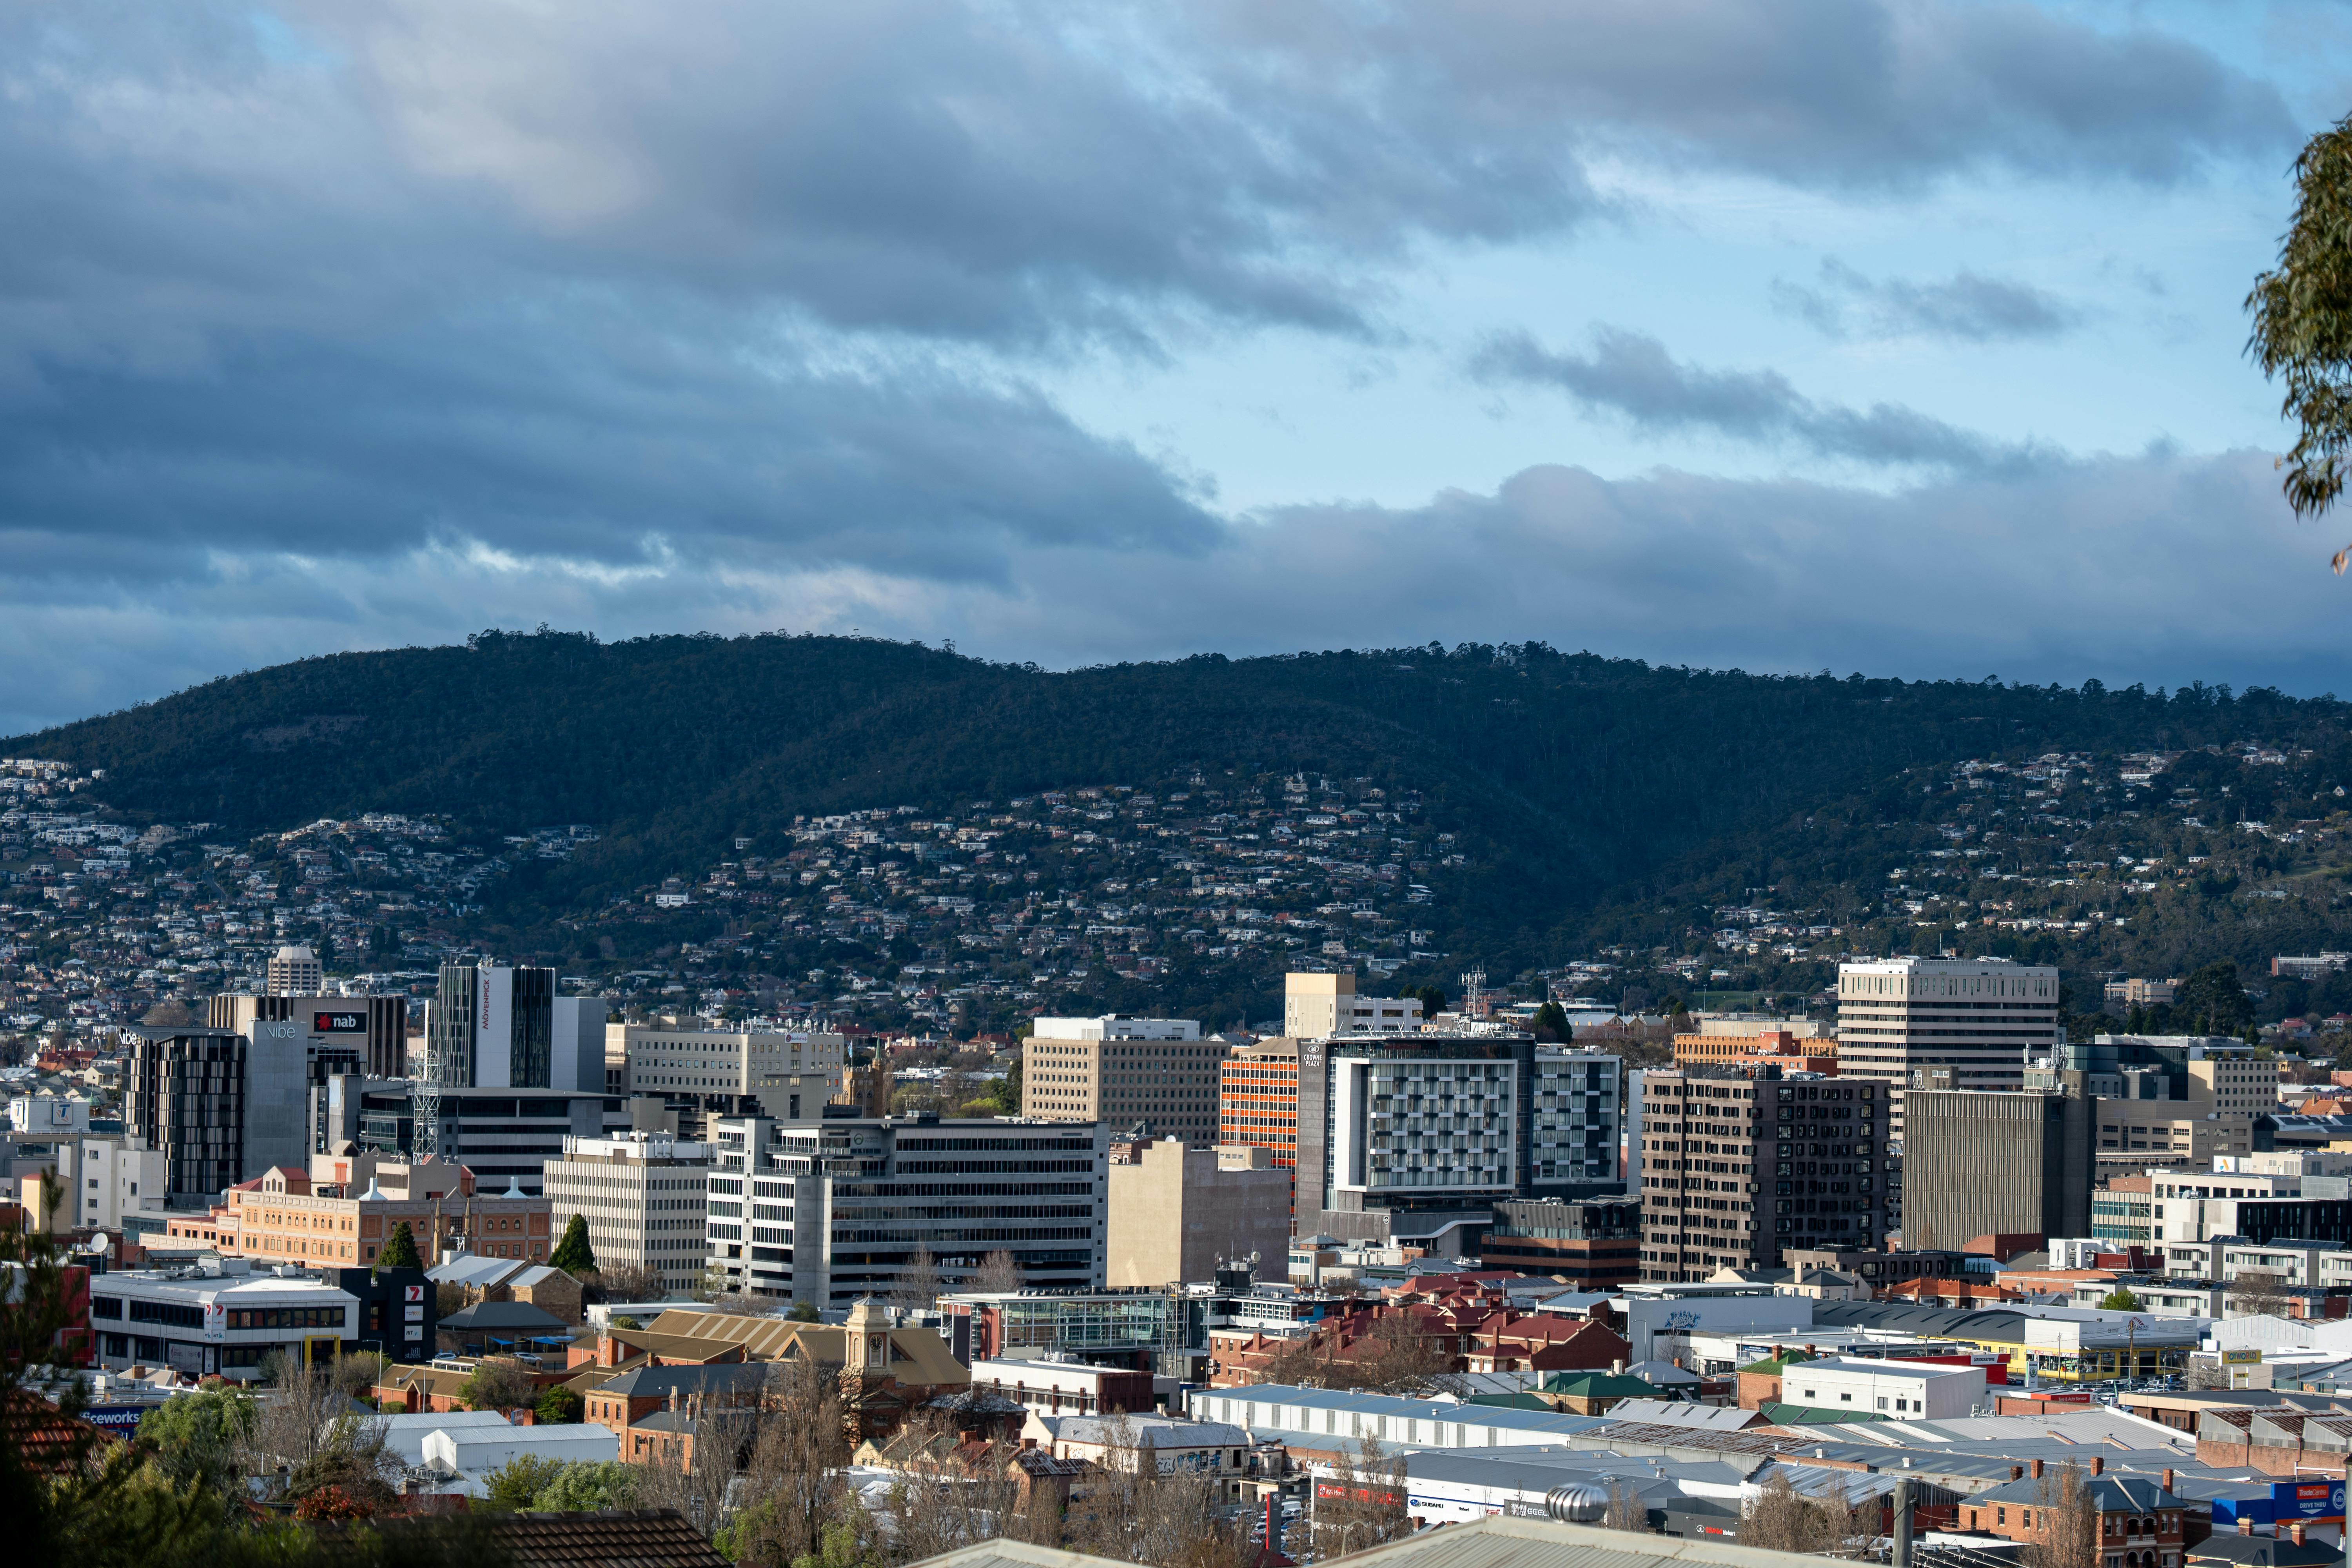 Hobart
Image by:Mark Direen
Hobart
Image by:Mark Direen
Hobart and Jalna represent fundamentally different urban environments, separated by vast economic structures and cost structures. Hobart, the capital of Tasmania, Australia, with a population of around 197,451, presents a developed city profile characterized by higher costs and comprehensive quality-of-life data. Jalna, in India, with a significantly larger population exceeding 393,000, offers a much lower-cost base but with less detailed information on living standards, particularly concerning safety, healthcare, and environmental quality. This initial disparity sets the stage for a clear, albeit stark, comparison.
The economic reality between these cities is pronounced. Hobart's cost of living is substantially higher, driven by elevated housing costs and, consequently, higher salaries. The average net monthly salary in Hobart reaches $4215.39 USD, reflecting its developed status. Renting a central 1-bedroom apartment costs $1845.91 USD per month, and buying property is expensive, with prices reaching $5745.04 USD per square meter. While Jalna's cost of living is considerably lower, specific rental or purchase prices aren't provided, making direct affordability comparisons difficult, though its overall index suggests significantly cheaper accommodation. Transportation costs in Hobart are higher than typical global averages, adding to the financial burden, even if Jalna's specific fuel costs are unknown.
When it comes to quality of life, the data reveals a significant gap, albeit with limitations for Jalna. Hobart performs considerably better on key indices, including a Quality of Life score of 201.2, a Safety Index of 65.67, and a Health Care Index of 64.2. It also boasts a lower Pollution Index (26.94) and a relatively efficient Traffic Commute Time Index (37.74). Crucially, Hobart provides detailed metrics and regional comparisons (like Launceston and Devonport) unavailable for Jalna. Jalna's single Quality of Life figure of 151.91 aligns with its lower cost index but lacks the context and breakdown needed to confidently assess its safety, healthcare access, environmental conditions, or public service levels, making a direct, meaningful comparison challenging.
From an investment and career standpoint, Hobart appears more favourable, despite the higher costs. It exhibits a much higher GDP per capita ($59,600 USD) and a slightly higher population growth rate (1.13%), suggesting a potentially more dynamic economy than can be inferred from Jalna's sparse dataset. The higher average salary in Hobart directly translates to greater potential earnings. Furthermore, Hobart offers data on broader economic indicators like GDP growth (3.44%) and implicitly better access to higher education and career advancement opportunities, contrasting sharply with the less defined prospects likely offered by Jalna.
Ultimately, the decision between Jalna and Hobart hinges on vastly different priorities and risk appetites. Jalna offers a compelling lower cost of living, potentially attractive for budget constraints. However, the lack of comprehensive quality-of-life data makes it difficult to confidently assess aspects like safety, healthcare quality, environmental conditions, and public services. Hobart, conversely, offers a much higher standard of living, backed by detailed data indicating strong quality of life, safety, and healthcare, alongside higher salaries and economic indicators. While the financial burden is substantially greater, the potential for better career prospects, higher purchasing power (relative to its cost), and a more defined quality profile makes Hobart the preferable choice for those prioritizing a developed urban environment, economic stability, and a holistic understanding of living standards.
 Jalna
Jalna Hobart
Local cuisine & dishes
Jalna
Hobart
 Jalna
Jalna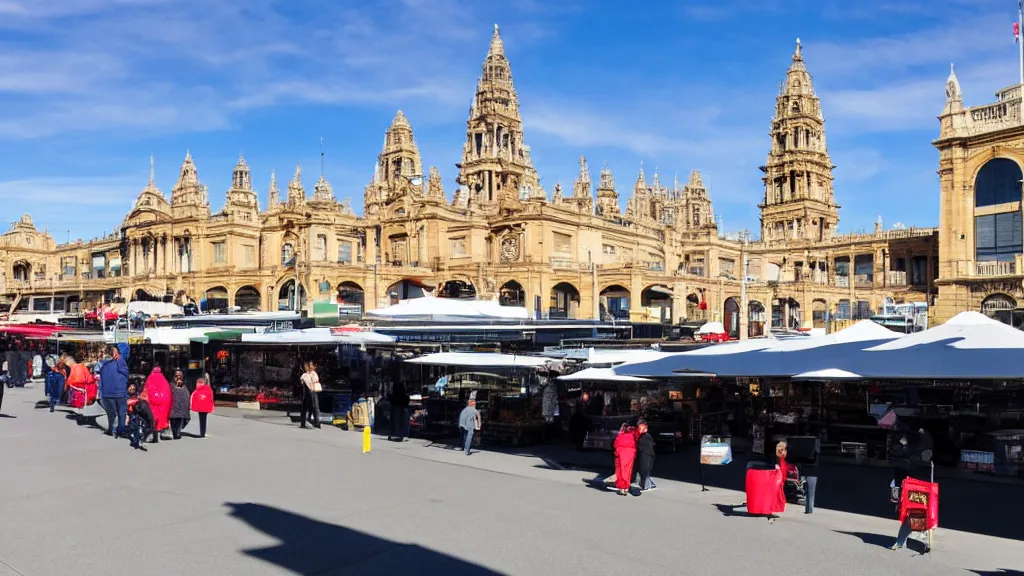 Hobart
Travel & attractions
Jalna
Hobart
Real estate & living comparison
| Jalna | Hobart | |
|---|---|---|
| International Primary School, Annual Tuition per Child | 2476.24 USD | 21298.97 USD |
| Private Full-Day Preschool or Kindergarten, Monthly Fee per Child | 107.97 USD | 2011.67 USD |
| Jeans (Levi's 501 or Similar) | 33.87 USD | 78.65 USD |
| Men's Leather Business Shoes | 40.02 USD | 126.89 USD |
| Apples (1 kg) | 2.48 USD | 3.17 USD |
| Bananas (1 kg) | 0.69 USD | 3.32 USD |
| Bottled Water (0.33 Liter) | 0.19 USD | 2.13 USD |
| Cappuccino (Regular Size) | 2.44 USD | 3.87 USD |
| Annual Mortgage Interest Rate (20-Year Fixed, in %) | 8.8 USD | 5.85 USD |
| Cinema Ticket (International Release) | 5.44 USD | 17.04 USD |
| Gasoline (1 Liter) | 1.16 USD | 1.23 USD |
| Taxi 1 Hour Waiting (Standard Tariff) | 2.18 USD | 42.6 USD |
| Basic Utilities for 85 m2 Apartment (Electricity, Heating, Cooling, Water, Garbage) | 30.89 USD | 227.27 USD |
| Broadband Internet (Unlimited Data, 60 Mbps or Higher) | 8.08 USD | 61.39 USD |
| Population | 393,000 | 197,451 |
Last updated: 2026-04-05T11:41:09+00:00
Comments for this comparison