Kaithal vs. Chinandega: Detailed 2026 Cost of Living & Quality Comparison
 Kaithal
Image by:Anoop VS
Kaithal
Image by:Anoop VS
 Chinandega
Image by:Usiel Rios
Chinandega
Image by:Usiel Rios
Kaithal's economy, while showing signs of dynamism with a higher GDP per capita ($9,200) and faster growth (8.15%) compared to Chinandega's $7,500 and 4.57%, presents a data-poor landscape. Crucially, there are no specific figures on household incomes or housing affordability for Kaithal, leaving a significant gap in understanding the real-world economic pressures faced by its residents. This lack of granular data makes it difficult to assess the direct translation of economic growth into living standards or the burden of basic expenses like rent and mortgages.
The housing market highlights a stark disparity in data availability. Chinandega provides extensive property price information, revealing significant geographic variation within the city – from $26.78 in El Viejo to $171.30 in Sebaco – offering a clear picture of where living might be more or less affordable. Kaithal, however, offers no such transparency, lacking even basic real estate price points or mortgage rate information. This absence makes any meaningful comparison of housing costs between the two cities impossible, despite the differing economic profiles.
Assessing quality of life factors paints a similarly contrasting picture. Kaithal's dataset is severely limited, providing only three basic food item prices (milk, white rice, eggs). This offers virtually no insight into the cost of groceries more broadly, let alone essential services like healthcare, safety, or environmental quality. In contrast, Chinandega presents a much richer tapestry, detailing prices for over 100 diverse items and services, including childcare and utilities, alongside comprehensive Cost of Living and Property Price indices. This allows for a far more thorough evaluation of affordability and living standards across multiple dimensions.
When considering investment and career prospects, the data again favors Chinandega's transparency. While Kaithal shows a faster population growth rate (0.72%) potentially indicating dynamism, specific investment data or job market details are absent. Chinandega, conversely, provides concrete details like its 10.25% mortgage interest rate and extensive affordability indices, enabling more informed investment decisions. The broader range of cost-of-living data also allows for better assessments of potential career sustainability, although slower overall growth (4.57%) contrasts with Kaithal's economic expansion pace.
In conclusion, the available data reveals two fundamentally different cities. Kaithal appears potentially more affluent based on its higher GDP figures, but its sparse data on cost of living, housing, and quality of life metrics makes a comprehensive assessment elusive. Chinandega, despite its lower GDP per capita and slower growth, offers a remarkably detailed and nuanced dataset covering virtually all aspects of living and investing. This richness allows for a much more informed, albeit contrasting, view of life and opportunity in Nicaragua.
 Kaithal
 Chinandega
Local cuisine & dishes
Kaithal
Chinandega
 Kaithal
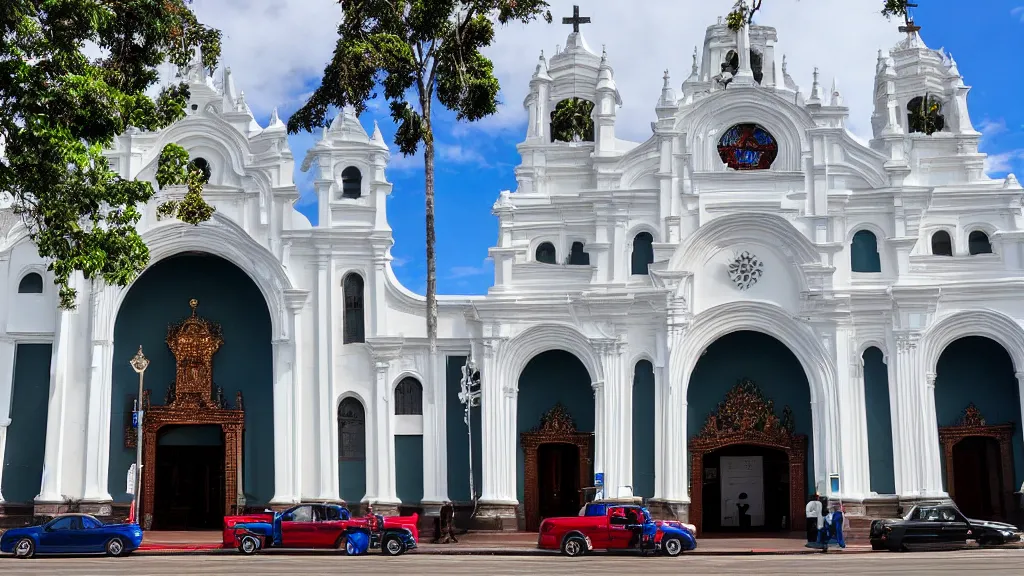 Chinandega
Travel & attractions
Kaithal
Chinandega
Real estate & living comparison
| Kaithal | Chinandega | |
|---|---|---|
| Eggs (12, Large Size) | 0.91 USD | 2.35 USD |
| Milk (Regular, 1 Liter) | 0.71 USD | 1.26 USD |
| GDP Growth Rate: | 8.15 USD | 4.57 USD |
| GDP Per Capita ($) : | 9200 USD | 7500 USD |
| Population | 144,915 | 121,793 |
Last updated: 2026-04-05T15:44:07+00:00
Comments for this comparison