Lancaster vs. Depok: Detailed 2026 Cost of Living & Quality Comparison
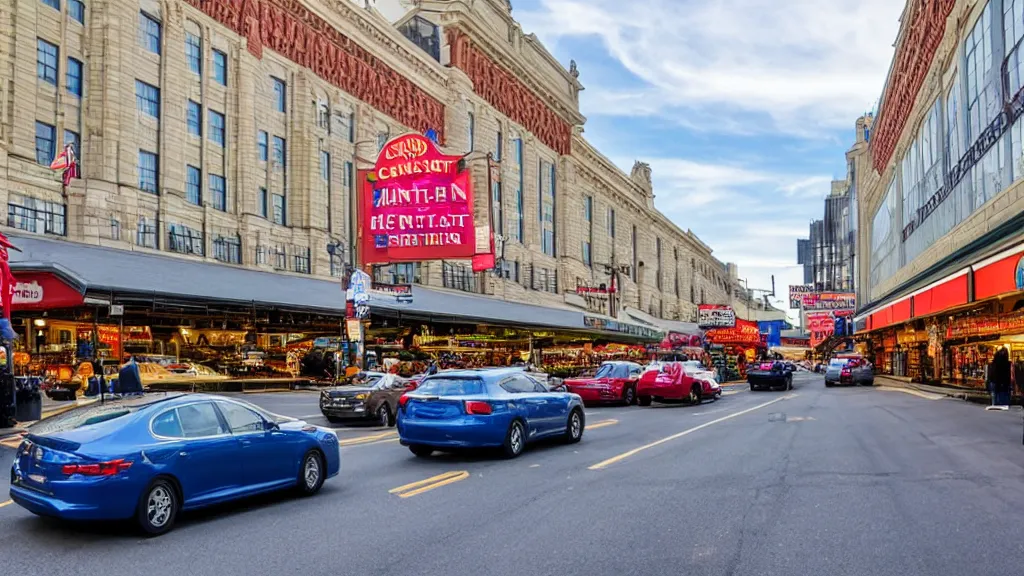
 Lancaster
Image by:Thomas Beaman
Lancaster
Image by:Thomas Beaman
 Depok
Image by:Reezky Pradata
Depok
Image by:Reezky Pradata
Lancaster, in the United States, presents a fundamentally different urban experience compared to Depok in Indonesia. The most striking difference lies in the cost structure. Lancaster's cost of living, particularly housing, is substantially higher than Depok's. For instance, a basic 1-bedroom apartment in Lancaster's city center averages $801.69 per month, significantly more than the $44.46 offered in Depok's off-center units. Furthermore, property prices in Lancaster are much steeper, with city-center square meter costs reaching $5,177.59, compared to Depok's $889.13. This disparity extends to income, where Lancaster's average monthly net salary is $2,506.32 USD, over six times Depok's $377.23 USD. While Lancaster's lower mortgage rate (4.99%) offers a slight advantage in financing, its overall economic indicators paint a picture of higher costs and higher earnings, contrasting sharply with Depok's lower costs and lower salaries.
The economic profiles of Lancaster and Depok diverge significantly beyond just salaries and housing costs. Lancaster boasts a substantially higher GDP per capita ($54,500 USD) and a lower mortgage interest rate (4.99%) than Depok ($13,900 USD GDP per capita, 9.25% mortgage rate). Depok, however, shows a slightly faster population growth rate (0.73% vs. Lancaster's 0.45%), suggesting potentially different demographic pressures. The high cost of living in Lancaster, while offset somewhat by higher salaries, still results in a much larger financial burden than in Depok, where lower costs directly correlate with lower average incomes. This economic gap directly influences the affordability and financial stability experienced by residents in each city.
Housing affordability and cost represent a critical area where the two cities differ vastly. Lancaster's city-center 1-bedroom apartments cost $801.69 per month, making them significantly more expensive than Depok's $44.46 off-center units. This translates to a stark difference in absolute affordability. While Depok's property prices ($889.13 per sqm) are much lower than Lancaster's ($5,177.59), the Property Price to Income Ratio in Depok stands at 10.8, indicating that while absolute cash flow might be easier, the long-term financial commitment relative to income could be less favorable than implied by simple cost figures alone, particularly given the much lower salaries in Depok.
Assessments of quality of life reveal significant disparities, often linked to the higher costs in Lancaster. Lancaster generally scores higher on quality of life indices, covering aspects like safety, healthcare, climate, and pollution, though specific numerical comparisons aren't provided for Depok except for lower scores in safety (44.14) and healthcare (59.72). Depok's quality of life metrics are considerably lower, with most scores significantly below 50 and a higher Pollution Index (72.13). This suggests that while Depok offers a much cheaper lifestyle, the overall standard of living, safety, and environmental conditions are perceived as inferior according to the available data.
For those considering investment and career prospects, Lancaster appears more promising based on the data. It offers a higher GDP per capita ($54,500 USD), a lower mortgage rate (4.99%), and higher potential salaries ($2,506.32 USD). Depok shows a higher GDP growth rate (5.05%), suggesting faster economic expansion, but its much lower GDP per capita ($13,900 USD) and lower salaries ($377.23 USD) indicate a less developed economic base. While Depok's mortgage rate (5.00%) is slightly lower, the much lower salaries mean the overall financial burden of homeownership or high living costs would be substantially greater in Depok than the relative figures suggest. Lancaster offers greater economic stability and potentially better career returns, albeit at a higher cost of living.
 Lancaster
 Depok
DepokLocal cuisine & dishes
Lancaster
Depok
 Lancaster
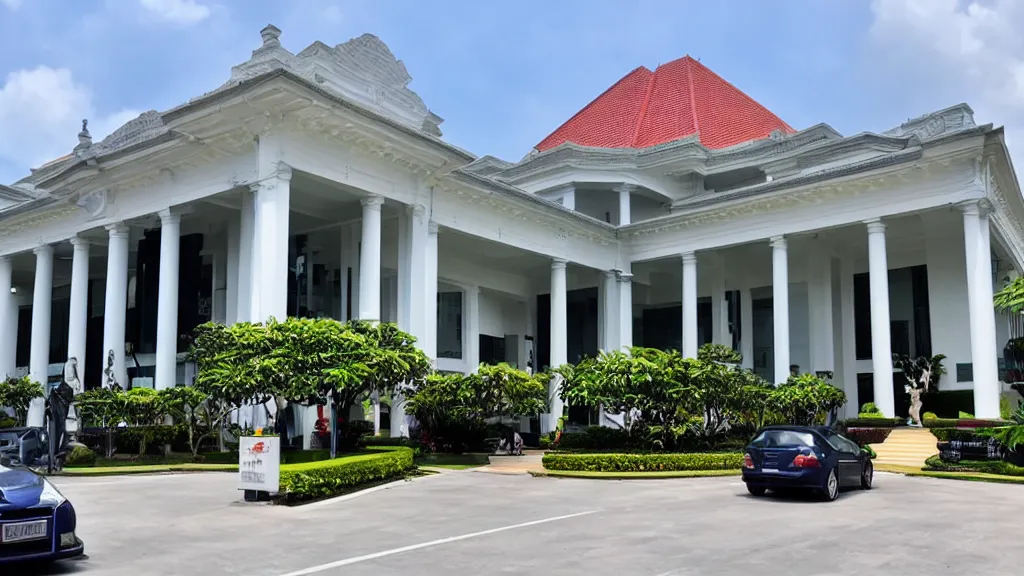 Depok
DepokTravel & attractions
Lancaster
Depok
Real estate & living comparison
| Lancaster | Depok | |
|---|---|---|
| Price per Square Meter to Buy Apartment in City Centre | 5177.59 USD | 889.13 USD |
| Price per Square Meter to Buy Apartment Outside of Centre | 9353.07 USD | 740.94 USD |
| International Primary School, Annual Tuition per Child | 22204.73 USD | 7600.44 USD |
| Private Full-Day Preschool or Kindergarten, Monthly Fee per Child | 1269.35 USD | 100.03 USD |
| Jeans (Levi's 501 or Similar) | 85.96 USD | 41.49 USD |
| Men's Leather Business Shoes | 40.08 USD | 75.12 USD |
| Bottle of Wine (Mid-Range) | 10.69 USD | 21.93 USD |
| Cigarettes (Pack of 20, Marlboro) | 20.04 USD | 2.85 USD |
| 1 Bedroom Apartment in City Centre | 1068.92 USD | 121.51 USD |
| 1 Bedroom Apartment Outside of City Centre | 801.69 USD | 44.46 USD |
| Cappuccino (Regular Size) | 4.33 USD | 1.6 USD |
| Combo Meal at McDonald's (or Equivalent Fast-Food Meal) | 9.35 USD | 3.44 USD |
| Annual Mortgage Interest Rate (20-Year Fixed, in %) | 5.64 USD | 5 USD |
| Average Monthly Net Salary (After Tax) | 2506.32 USD | 377.23 USD |
| Cinema Ticket (International Release) | 8.35 USD | 2.96 USD |
| Monthly Fitness Club Membership | 56.92 USD | 8.89 USD |
| Gasoline (1 Liter) | 1.82 USD | 0.76 USD |
| Monthly Public Transport Pass (Regular Price) | 66.81 USD | 8.89 USD |
| Broadband Internet (Unlimited Data, 60 Mbps or Higher) | 42.45 USD | 20.76 USD |
| Mobile Phone Plan (Monthly, with Calls and 10GB+ Data) | 17.04 USD | 5.24 USD |
| Population | 170,013 | 2,330,333 |
Last updated: 2026-04-05T12:01:24+00:00
Comments for this comparison