Pucallpa vs. Tabūk: Detailed 2026 Cost of Living & Quality Comparison
 Pucallpa
Image by:Carlosfrancisco Martín Leiva Martínez
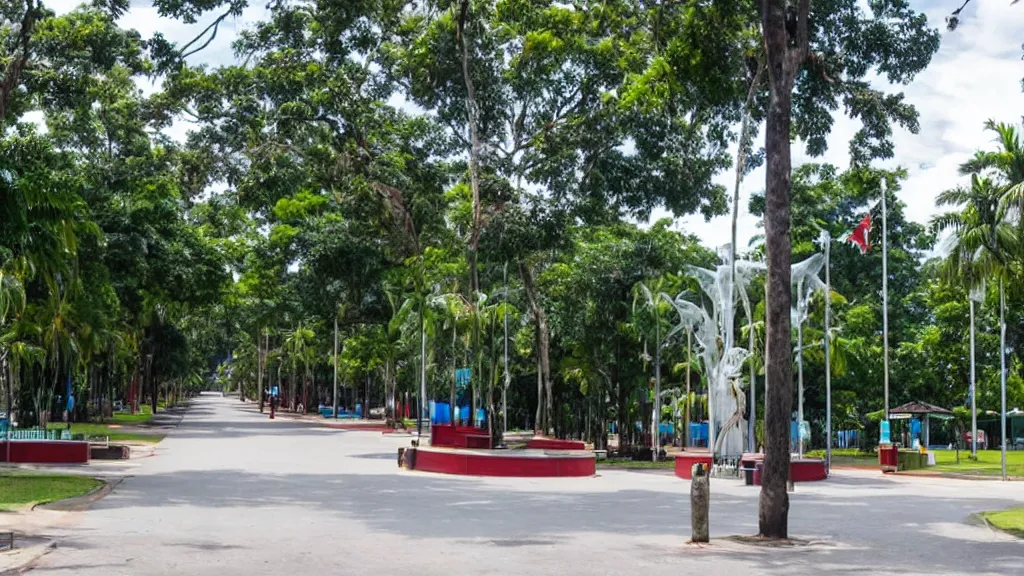
Pucallpa
Image by:Carlosfrancisco Martín Leiva Martínez
 Tabuk
Image by:SALEH .
Tabuk
Image by:SALEH .
Pucallpa and Tabūk present fundamentally contrasting urban environments in 2026, with their economic structures and cost of living levels defining the core differences. Pucallpa, Peru's second-largest city with a population of around 326,000, offers a significantly lower cost of living compared to Tabūk, Saudi Arabia's thriving port city home to nearly 887,000 people. This disparity is starkly reflected in income; Pucallpa's average net monthly salary after tax is $419.36 USD, a fraction of the $1,731.86 USD earned in Tabūk. This income gap is mirrored in economic development, as Pucallpa's GDP per capita of $15,300 USD is substantially lower than Tabūk's $55,100 USD, indicating a clear difference in economic power and purchasing power between the two locations.
The economic disparity inevitably shapes housing costs. While Pucallpa's average net salary is considerably lower, its housing costs remain significantly more affordable. A 1-bedroom apartment in Pucallpa's city center averages just $97.23 USD per month, a tiny fraction of the $317.79 USD required for the same in Tabūk. Even a 3-bedroom apartment in Pucallpa's center, priced at $191.62 USD, is substantially cheaper than the $630.59 USD needed for a comparable unit in Tabūk. This suggests that while salaries are lower in Pucallpa, the city offers vastly reduced expenses for basic accommodation, reinforcing the overall lower cost-of-living environment.
Quality of life factors, particularly safety and healthcare access, show a marked divergence. Pucallpa's Safety Index is considerably lower at 15.00, suggesting greater safety concerns than Tabūk's much higher Safety Index of 72.94. Healthcare accessibility also differs significantly, with Pucallpa's Health Care Index at 15.00 contrasting sharply with Tabūk's higher Health Care Index of 58.33. Although specific commute times for Pucallpa are not provided, Tabūk's available Traffic Commute Time Index of 20.0 implies relatively short commutes compared to some global benchmarks, though this lacks direct comparison. Environmentally, Tabūk's higher Pollution Index of 76.15 suggests potentially worse air quality than Pucallpa's 15.00 reading.
For those prioritizing career prospects and investment potential, the data points towards vastly different opportunities. Tabūk demonstrates significantly higher potential for earnings and growth. Its GDP per capita is nearly four times higher than Pucallpa's ($55,100 USD vs. $15,300 USD), and its GDP growth rate (0.75%) is also higher than Pucallpa's (0.55%). Tabūk's population growth rate (1.68%) is likewise greater than Pucallpa's (0.48%). The substantial difference in average net salary ($1,731.86 USD vs. $419.36 USD) underscores the potential for a higher standard of living in Tabūk, though this comes with correspondingly higher costs for goods and services, reflecting the city's robust economy.
Ultimately, the choice between Pucallpa and Tabūk hinges on critical priorities. Pucallpa offers a substantially lower cost of living, particularly for housing, alongside lower average incomes and potentially less developed quality of life in terms of safety and healthcare. Tabūk, conversely, offers a much higher cost of living, matched by substantially higher salaries, a higher GDP per capita, and indicators suggesting a better quality of life regarding safety, healthcare, and infrastructure. The decision depends on whether an individual prioritizes budget constraints and tolerance for potentially lower quality services, or the ability to afford a higher cost of living for access to better economic opportunities, healthcare, and perceived safety.
 Pucallpa
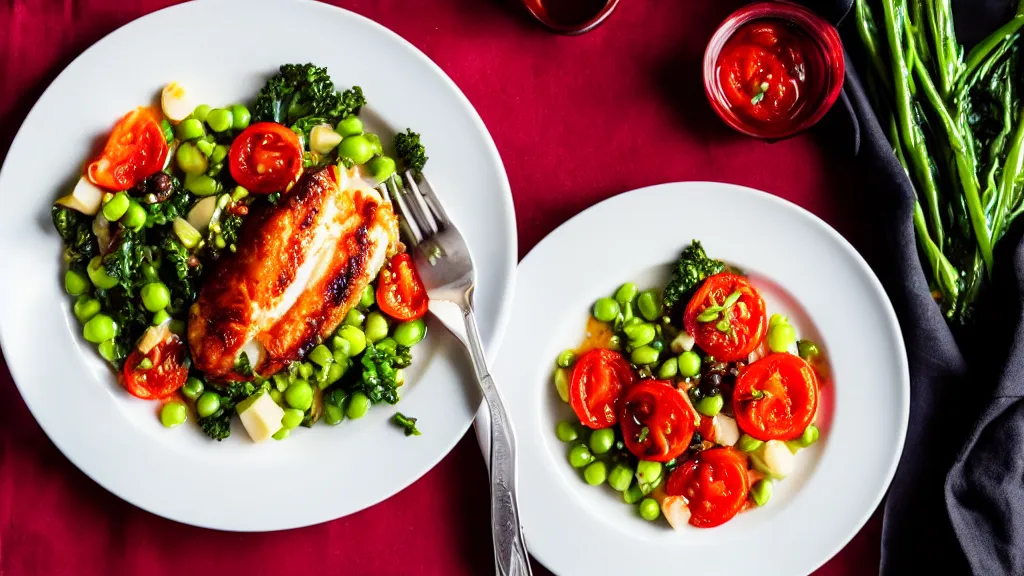 Tabuk
TabukLocal cuisine & dishes
Pucallpa
Tabuk
 Pucallpa
 Tabuk
TabukTravel & attractions
Pucallpa
Tabuk
Real estate & living comparison
| Pucallpa | Tabuk | |
|---|---|---|
| Apples (1 kg) | 2.38 USD | 1.96 USD |
| Bananas (1 kg) | 1.49 USD | 1.57 USD |
| 1 Bedroom Apartment in City Centre | 118.91 USD | 386.35 USD |
| 3 Bedroom Apartment in City Centre | 237.81 USD | 630.59 USD |
| Bottled Water (0.33 Liter) | 0.3 USD | 0.27 USD |
| Cappuccino (Regular Size) | 2.08 USD | 3.02 USD |
| Average Monthly Net Salary (After Tax) | 419.36 USD | 1731.91 USD |
| GDP Growth Rate: | 0.55 USD | 0.75 USD |
| Gasoline (1 Liter) | 1.28 USD | 0.64 USD |
| One-Way Ticket (Local Transport) | 1.19 USD | 2.4 USD |
| Basic Utilities for 85 m2 Apartment (Electricity, Heating, Cooling, Water, Garbage) | 53.51 USD | 159.86 USD |
| Broadband Internet (Unlimited Data, 60 Mbps or Higher) | 44.59 USD | 104.24 USD |
| Population | 326,040 | 886,036 |
Last updated: 2026-04-05T15:41:21+00:00
Comments for this comparison