Quebec City vs. Kiambu: Detailed 2026 Cost of Living & Quality Comparison
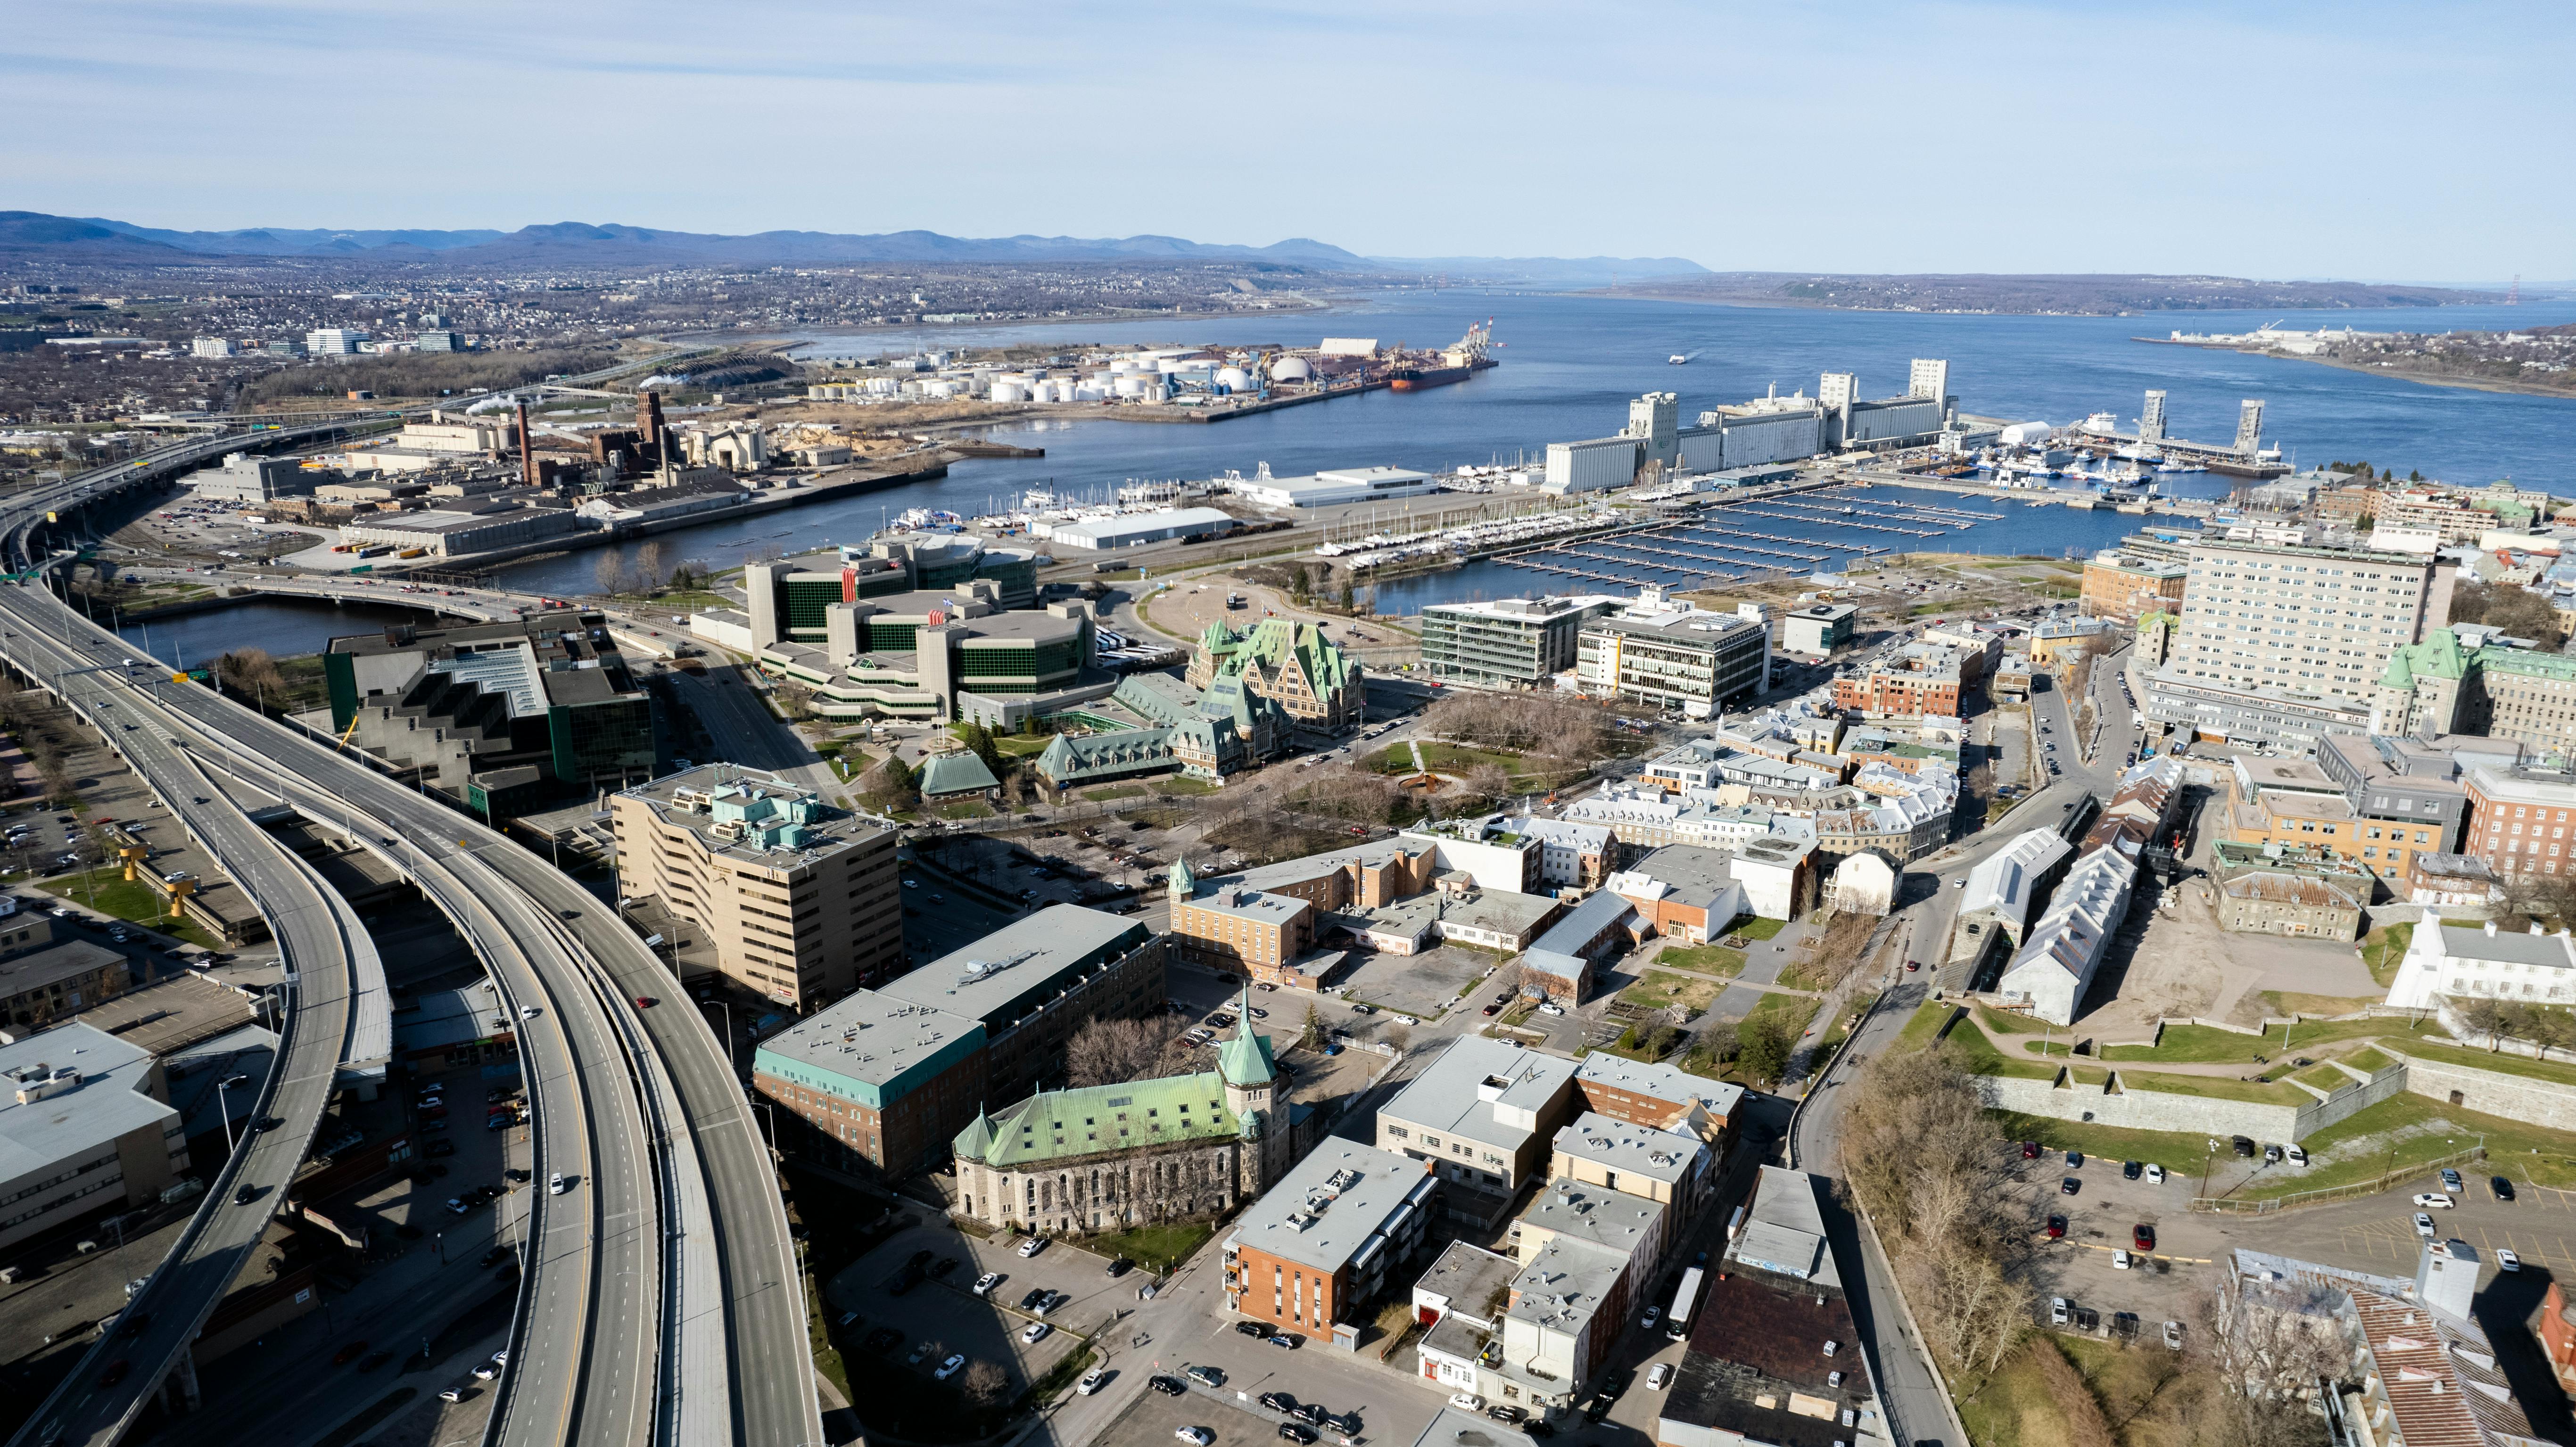 Quebec City
Image by:Felix-Antoine Coutu
Quebec City
Image by:Felix-Antoine Coutu
 Kiambu
Image by:African Explorer
Kiambu
Image by:African Explorer
Quebec City operates on a vastly different scale from Kiambu, reflected in their economic structures and living expenses. Quebec City's economy is significantly more robust, with an average net monthly salary of $2,930, nearly ten times higher than Kiambu's $274. This economic strength is mirrored in its GDP per capita ($55,900 vs. $5,700) and lower mortgage interest rates (4.76% vs. 15.12%), although Quebec City's property prices remain substantially higher, averaging $5,963 per square meter in the city center compared to Kiambu's $1,162. While Quebec City's population is much larger (733,156 vs. 147,870), Kiambu's population is growing slightly faster (2.06% vs. 0.71%). The data clearly positions Quebec City as an economically superior location, but one with correspondingly higher costs.
The gap in housing affordability between Quebec City and Kiambu is stark. Average property prices in Quebec City's center are over four times higher ($5,963/m²) than in Kiambu's center ($1,162/m²). This high cost is part of a broader pattern where Quebec City's cost of living, particularly for essentials, is significantly elevated compared to Kiambu. While Quebec City offers more extensive quality-of-life data, the available figures for Kiambu are sparse, relying heavily on Nairobi's metrics. Quebec City's quality-of-life indicators, where available, suggest a more developed environment, though direct comparison is limited by Kiambu's data paucity.
When evaluating quality of life, Quebec City presents a much clearer, albeit higher-cost, picture than Kiambu. Quebec City scores higher on key indices like Safety (77.4), Healthcare Access (69.03), and Commute Times (33.44), indicating a comfortable urban environment. Its overall Quality of Life Index (185.29) is considerably higher than the single Nairobi index value used as a proxy for Kiambu (15.48). Conversely, Quebec City's Cost of Living Index (59.55) is significantly higher than implicit Kiambu figures. The lack of comprehensive quality data for Kiambu makes definitive comparisons difficult, but Quebec City's available metrics paint a superior living environment.
For investment and career opportunities, Quebec City offers substantially superior prospects compared to Kiambu. The combination of higher average salaries ($2,930/month), lower mortgage rates (4.76%), and a robust economy (GDP per capita $55,900) creates a favorable environment for career growth and investment. Quebec City's stable population growth (0.71%) further supports this. In contrast, Kiambu presents a much lower economic base, with salaries ($274/month), a higher mortgage rate (15.12%), and a lower GDP per capita ($5,700). Despite slightly higher population growth (2.06%), Kiambu's overall economic indicators suggest fewer opportunities for significant investment returns or career advancement.
In summary, Quebec City emerges as a significantly more developed and economically vibrant city with a high quality of life, albeit at a substantial cost. Its robust economy, lower mortgage rates, and extensive quality-of-life data make it attractive for those prioritizing economic stability and career development. Kiambu, conversely, offers drastically lower living expenses but presents a vastly different reality – a smaller Kenyan town with a much lower economic base, limited quality-of-life data, and significantly lower income potential. The choice hinges entirely on individual priorities: Quebec City for economic opportunity and a developed lifestyle, and Kiambu for those prioritizing extreme affordability, accepting the limitations of data and fewer prospects.
 Quebec City
 Kiambu
Local cuisine & dishes
Quebec City
Kiambu
 Quebec City
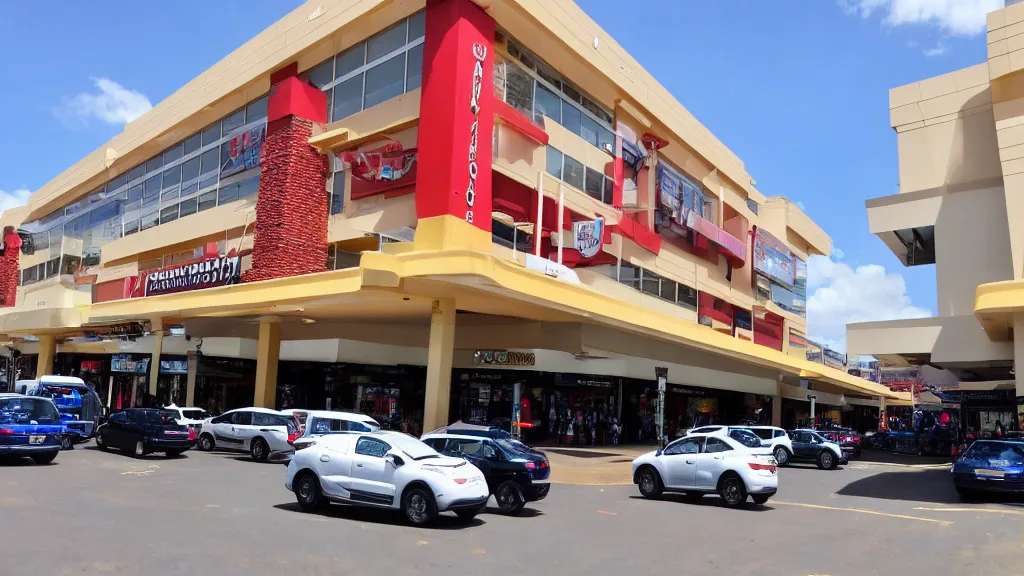 Kiambu
Travel & attractions
Quebec City
Kiambu
Real estate & living comparison
| Quebec City | Kiambu | |
|---|---|---|
| Price per Square Meter to Buy Apartment in City Centre | 5963.48 USD | 1161.57 USD |
| International Primary School, Annual Tuition per Child | 9610.74 USD | 9032.48 USD |
| Private Full-Day Preschool or Kindergarten, Monthly Fee per Child | 715.78 USD | 219.64 USD |
| Jeans (Levi's 501 or Similar) | 59.94 USD | 6.2 USD |
| Men's Leather Business Shoes | 112.9 USD | 31.01 USD |
| Apples (1 kg) | 4.31 USD | 3.1 USD |
| Bananas (1 kg) | 1.58 USD | 1.01 USD |
| 1 Bedroom Apartment in City Centre | 950.76 USD | 116.16 USD |
| 1 Bedroom Apartment Outside of City Centre | 791.57 USD | 92.93 USD |
| Bottled Water (0.33 Liter) | 1.51 USD | 0.35 USD |
| Cappuccino (Regular Size) | 3.92 USD | 1.94 USD |
| Annual Mortgage Interest Rate (20-Year Fixed, in %) | 4.76 USD | 15.12 USD |
| Average Monthly Net Salary (After Tax) | 2930.31 USD | 273.62 USD |
| Cinema Ticket (International Release) | 11.33 USD | 5.81 USD |
| Monthly Fitness Club Membership | 39.27 USD | 11.63 USD |
| Gasoline (1 Liter) | 1.17 USD | 1.42 USD |
| One-Way Ticket (Local Transport) | 2.74 USD | 0.54 USD |
| Basic Utilities for 85 m2 Apartment (Electricity, Heating, Cooling, Water, Garbage) | 104.8 USD | 28.24 USD |
| Broadband Internet (Unlimited Data, 60 Mbps or Higher) | 45.09 USD | 29.07 USD |
| Population | 733,156 | 147,870 |
Last updated: 2026-04-05T15:34:09+00:00
Comments for this comparison