Qujing vs. Monterrey: Detailed 2026 Cost of Living & Quality Comparison
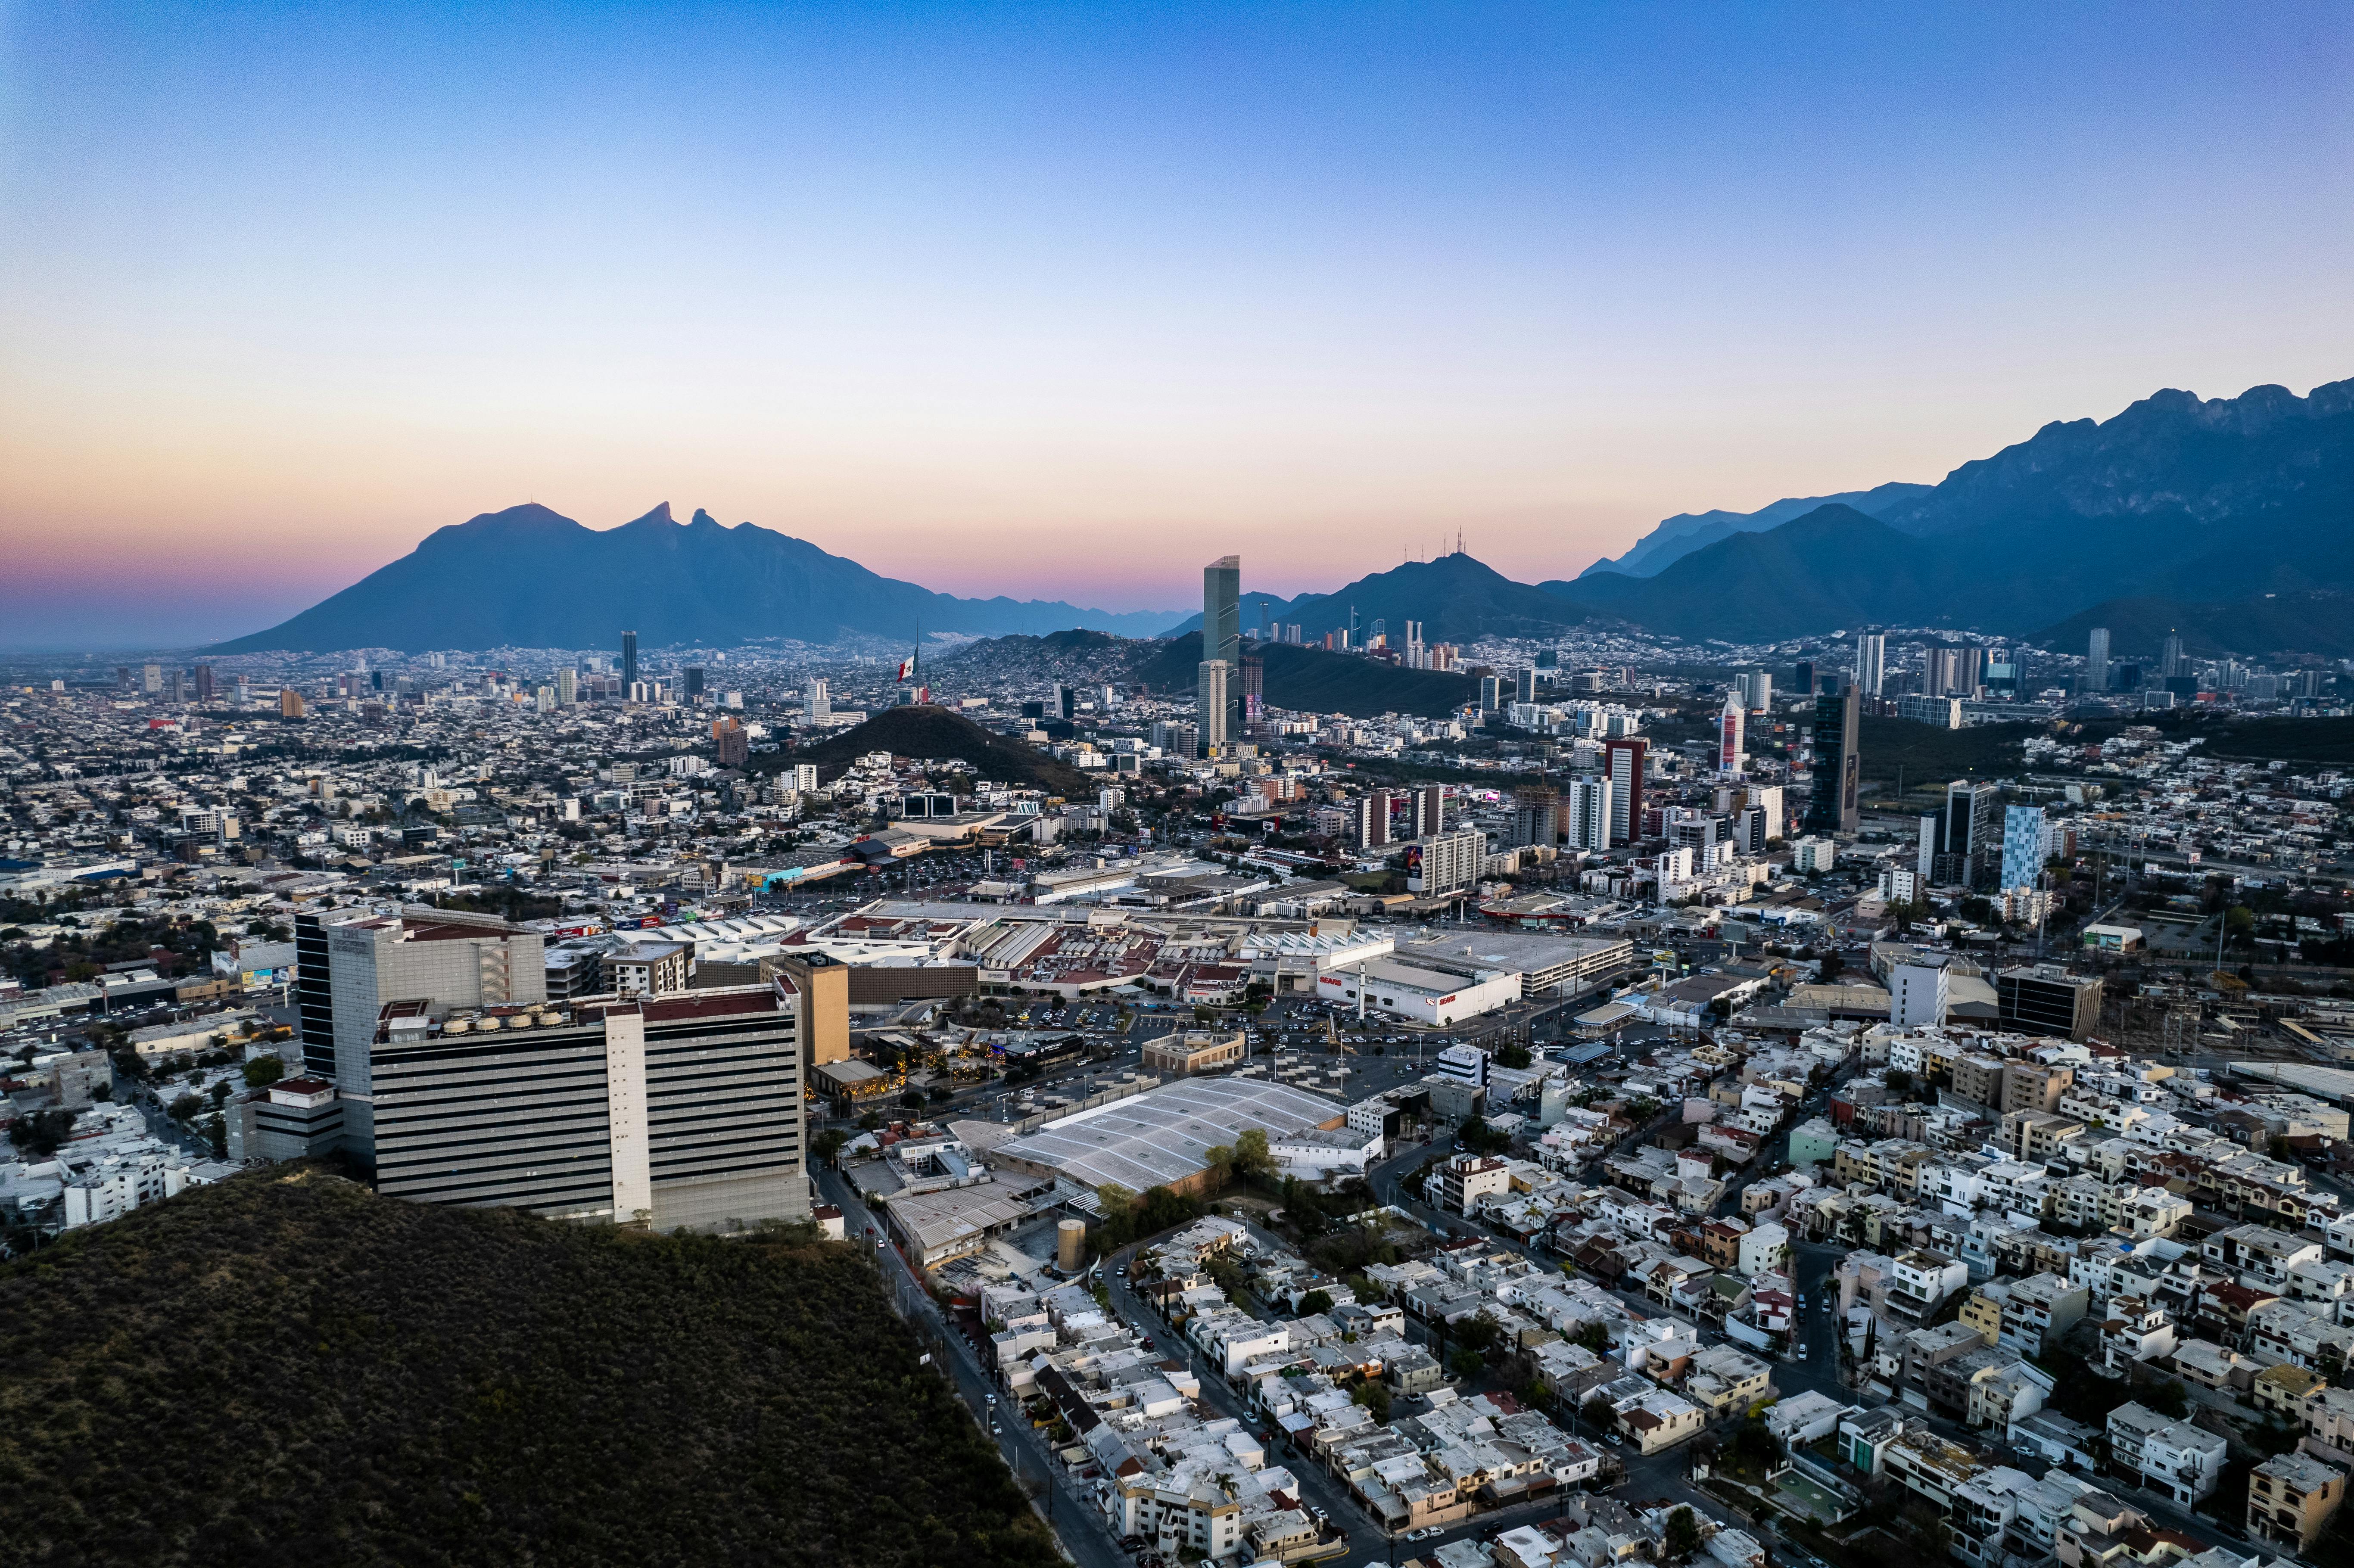 Monterrey
Image by:Gino Gonzalez
Monterrey
Image by:Gino Gonzalez
Qujing and Monterrey represent vastly different urban environments, distinguished primarily by their geographical locations, economic structures, and the scope of available data regarding quality of life. Qujing, situated in China, is a significant metropolis with a population exceeding five million, characterized by a GDP per capita of $22,100 and a relatively high GDP growth rate of 5.25%. However, the quality data provided for Qujing is notably limited and appears to reference cost of living metrics rather than traditional quality-of-life indicators, making direct comparisons in this area challenging. In contrast, Monterrey, located in Mexico, is also a major city with a comparable population size and GDP per capita of $22,100, but it exhibits a lower GDP growth rate of 3.2%. Monterrey provides a more comprehensive dataset for quality assessment, including indices for safety, healthcare, climate, and pollution, offering a clearer picture of its living environment despite a lower overall quality of life index compared to some unspecified locations.
When examining the economic and housing landscapes, the two cities present contrasting profiles. Monterrey boasts a higher average monthly net salary after tax ($1,042.57) compared to Qujing ($943.07). However, this advantage is partially offset by significantly higher property prices in Monterrey, where the cost of a city-center apartment per square meter is $4,297.71, far exceeding Qujing's $144.69/m². The annual mortgage interest rate in Qujing is substantially lower at 3.0%, compared to Monterrey's considerably higher rate of 11.62%. Furthermore, while Monterrey provides detailed rental price data, Qujing lacks comparable figures, hindering a complete analysis of housing affordability in the Chinese city. The differing economic structures and data availability make a direct comparison of investment potential and career opportunities difficult without further information.
The quality of life comparison between Qujing and Monterrey is hampered by the scarcity and nature of the data available for Qujing. Monterrey offers a range of quality metrics, including a Quality of Life Index of 117.16, a Purchasing Power Index of 56.01, and specific indices for safety (52.01), healthcare (68.82), and climate (80.37), along with pollution data (71.0). These indicators paint a picture of a developed metropolis with measurable aspects of urban living. Qujing, conversely, lacks such detailed quality-of-life measurements. The only quality-related figures provided for Qujing appear to be cost of living equivalents, which are not direct proxies for well-being factors like public services, environmental quality, or social amenities. This data gap makes it impossible to meaningfully compare the actual living experience, environmental conditions, and public service levels between the two cities based on the provided information.
Monterrey demonstrates a more developed framework for understanding investment, career prospects, and quality-of-life considerations, although it presents a higher cost of living. Monterrey's GDP growth rate is lower (3.2%) than Qujing's (5.25%), and its population growth rate is also slightly lower (0.72% vs. Qujing's unspecified rate). However, Monterrey provides detailed property price indices for various locations (García, Ciudad Sabinas Hidalgo, etc.), which, while high, offer transparency for potential investors. The city also provides data on childcare costs and primary school tuition, areas often crucial for families considering relocation. Qujing offers data on GDP growth and population growth but lacks detailed property price indices outside of cost of living metrics and does not provide any data on childcare or education costs, leaving significant gaps in understanding its investment and family-oriented potential.
In conclusion, while both Qujing and Monterrey are substantial cities with populations around five million, they differ significantly in their economic characteristics and the availability of quality-of-life data. Monterrey presents a more complete dataset for evaluating quality, investment, and living costs, albeit at a higher expense level and with a higher mortgage interest rate. Qujing offers potentially lower living costs and a higher GDP growth rate but suffers from a severe lack of reliable data regarding quality of life, environmental factors, and specific service costs like childcare. The decision between these two cities would heavily depend on the priorities of the individual or organization, particularly concerning the relative importance of cost savings versus verifiable quality-of-life metrics and career development opportunities.
Real estate & living comparison
| Qujing | Monterrey | |
|---|---|---|
| Salaries And Financing » Annual Mortgage Interest Rate (20-Year Fixed, in %) | 3 USD | 11.62 USD |
| Salaries And Financing » Average Monthly Net Salary (After Tax) | 943.07 USD | 1042.57 USD |
| Salaries And Financing » GDP Growth Rate: | 5.25 USD | 3.2 USD |
| Salaries And Financing » GDP Per Capita ($) : | 22100 USD | 22100 USD |
| Salaries And Financing » Population Growth Rate: | 0.23 USD | 0.72 USD |
| Clothing And Shoes » Jeans (Levi's 501 or Similar) | 58.03 USD | 70.62 USD |
| Clothing And Shoes » Men's Leather Business Shoes | 58.03 USD | 151.28 USD |
| Clothing And Shoes » Nike Running Shoes (Mid-Range) | 58.03 USD | 124.77 USD |
| Clothing And Shoes » Summer Dress in a Chain Store (e.g. Zara or H&M) | 43.53 USD | 43.23 USD |
| Markets » Apples (1 kg) | 1.45 USD | 3.69 USD |
| Markets » Bananas (1 kg) | 1.02 USD | 1.65 USD |
| Markets » Beef Round or Equivalent Back Leg Red Meat (1 kg) | 11.61 USD | 15.51 USD |
| Markets » Bottle of Wine (Mid-Range) | 18.86 USD | 11.99 USD |
| Markets » Bottled Water (1.5 Liter) | 0.73 USD | 1.24 USD |
| Markets » Chicken Fillets (1 kg) | 3.63 USD | 10.6 USD |
| Markets » Cigarettes (Pack of 20, Marlboro) | 3.63 USD | 4.8 USD |
| Markets » Domestic Beer (0.5 Liter Bottle) | 1.16 USD | 1.86 USD |
| Markets » Eggs (12, Large Size) | 1.74 USD | 2.64 USD |
| Markets » Fresh White Bread (500 g Loaf) | 1.31 USD | 3.03 USD |
| Markets » Imported Beer (0.33 Liter Bottle) | 2.18 USD | 3.12 USD |
| Markets » Milk (Regular, 1 Liter) | 1.45 USD | 1.92 USD |
| Markets » Oranges (1 kg) | 1.45 USD | 2.42 USD |
| Markets » Potatoes (1 kg) | 0.29 USD | 2.49 USD |
| Markets » White Rice (1 kg) | 0.73 USD | 2.23 USD |
| Restaurants » Bottled Water (0.33 Liter) | 0.29 USD | 1.08 USD |
| Restaurants » Cappuccino (Regular Size) | 2.18 USD | 3.99 USD |
| Restaurants » Combo Meal at McDonald's (or Equivalent Fast-Food Meal) | 4.35 USD | 11.53 USD |
| Restaurants » Domestic Draft Beer (0.5 Liter) | 1.16 USD | 2.88 USD |
| Restaurants » Imported Beer (0.33 Liter Bottle) | 2.18 USD | 4.61 USD |
| Restaurants » Meal at an Inexpensive Restaurant | 1.74 USD | 14.41 USD |
| Restaurants » Meal for Two at a Mid-Range Restaurant (Three Courses, Without Drinks) | 14.51 USD | 54.77 USD |
| Restaurants » Soft Drink (Coca-Cola or Pepsi, 0.33 Liter Bottle) | 0.44 USD | 1.54 USD |
| Salaries And Financing » Annual Mortgage Interest Rate (20-Year Fixed, in %) | 3 USD | 11.62 USD |
| Salaries And Financing » Average Monthly Net Salary (After Tax) | 943.07 USD | 1042.57 USD |
| Sports And Leisure » Cinema Ticket (International Release) | 5.08 USD | 5.77 USD |
| Sports And Leisure » Monthly Fitness Club Membership | 14.51 USD | 34.83 USD |
| Transportation » Gasoline (1 Liter) | 1.16 USD | 1.49 USD |
| Transportation » Monthly Public Transport Pass (Regular Price) | 36.27 USD | 33.21 USD |
| Transportation » One-Way Ticket (Local Transport) | 0.29 USD | 0.86 USD |
| Transportation » Taxi Start (Standard Tariff) | 1.16 USD | 1.73 USD |
| Transportation » Toyota Corolla Sedan 1.6 (or Equivalent New Mid-Size Car) | 16685.04 USD | 26100.49 USD |
| Utilities (Monthly) » Broadband Internet (Unlimited Data, 60 Mbps or Higher) | 4.35 USD | 31.59 USD |
| Utilities (Monthly) » Mobile Phone Plan (Monthly, with Calls and 10GB+ Data) | 7.25 USD | 32 USD |
| Population | 5,765,775 | 5,324,281 |
Comments for this comparison