Smolensk vs. Homs: Detailed 2026 Cost of Living & Quality Comparison
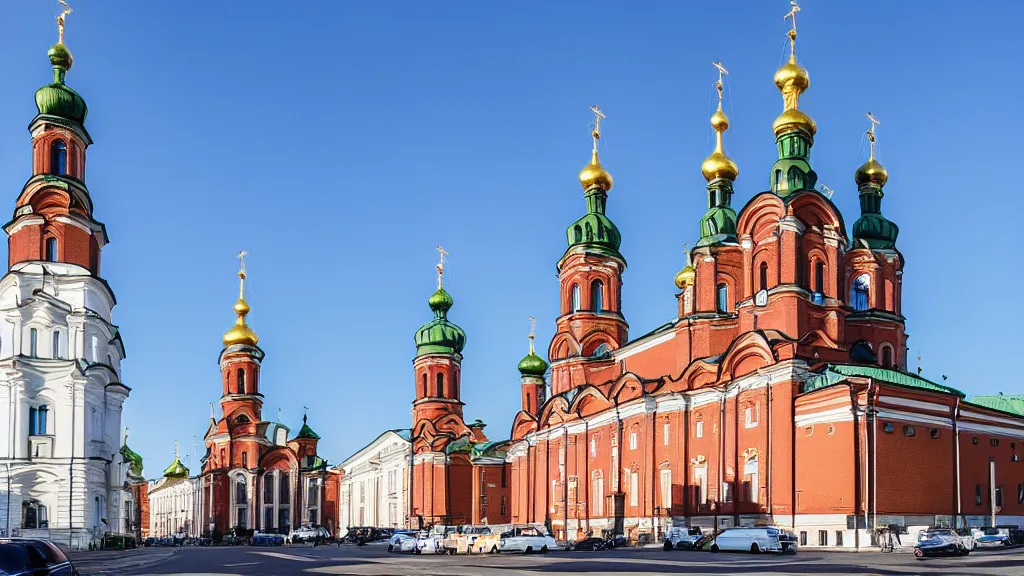
 Smolensk
Image by:Irina Balashova
Smolensk
Image by:Irina Balashova
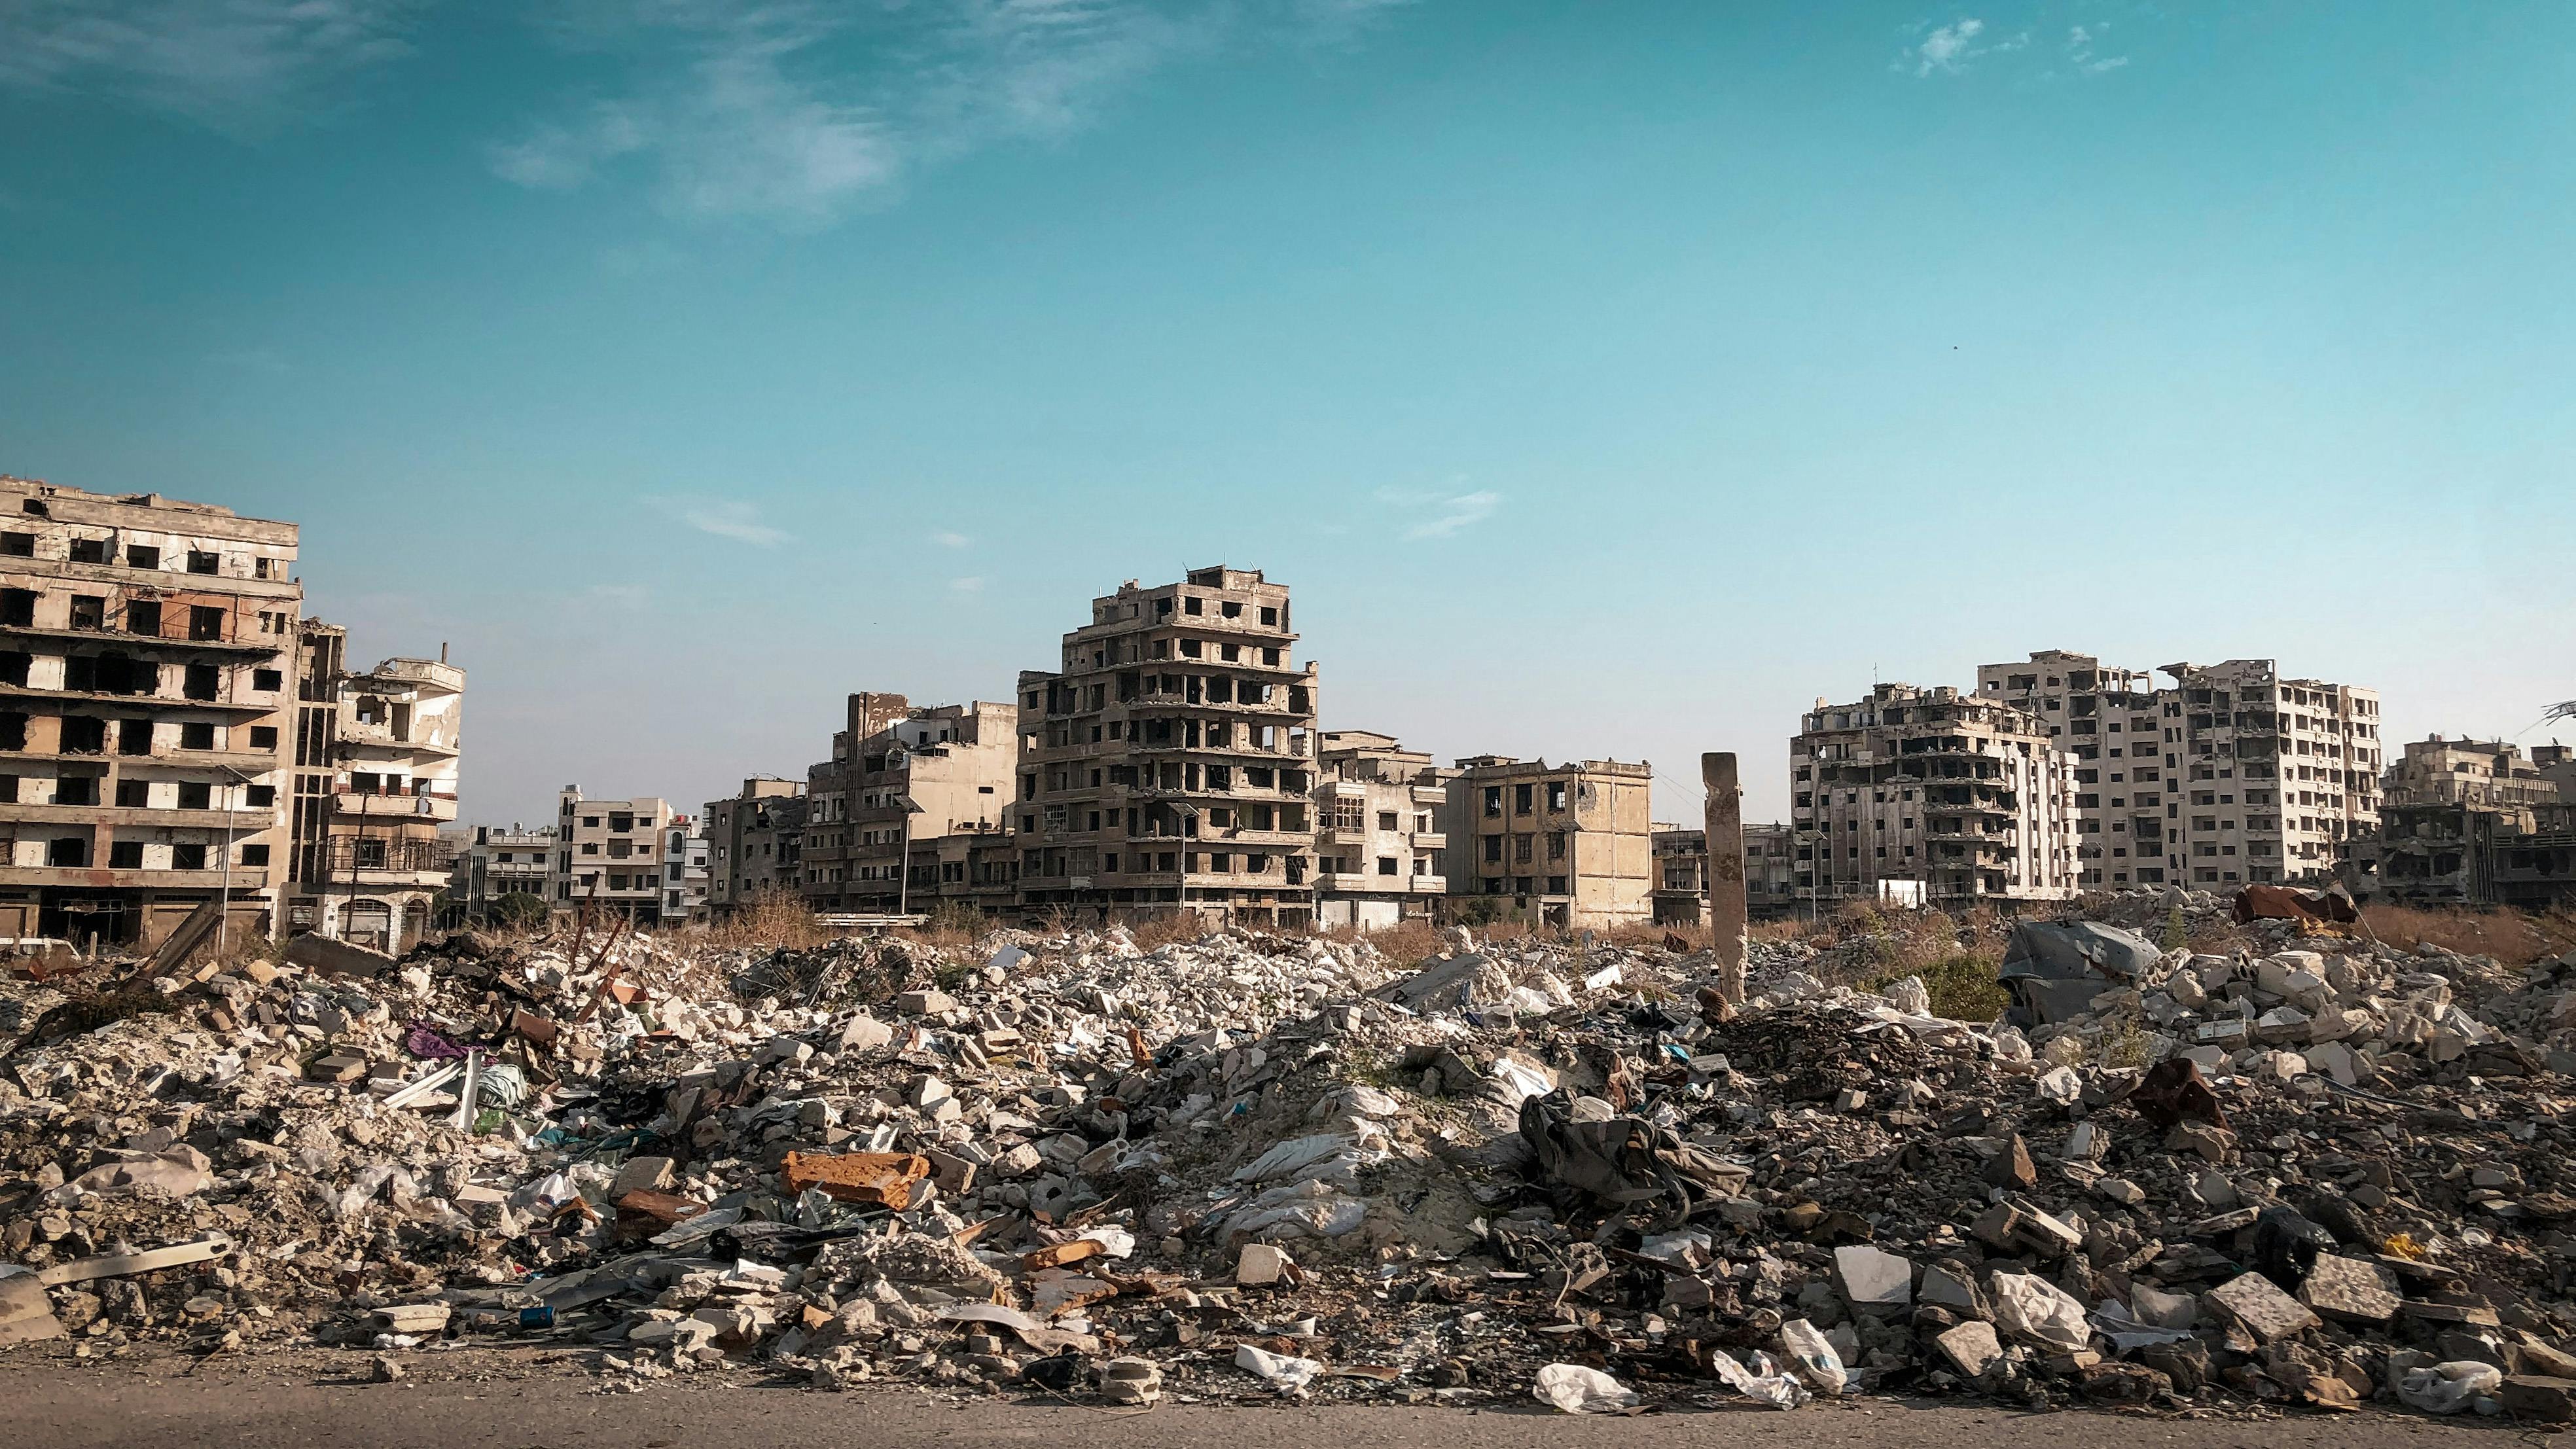 Homs
Image by:ali Saleh
Homs
Image by:ali Saleh
Smolensk and Homs present fundamentally contrasting profiles in 2026, reflecting vastly different economic realities and living standards. Smolensk, with a population exceeding 312,000, benefits from Russia's significantly higher GDP per capita of $39,800 compared to Syria's considerably lower figure of $4,500 for Homs. This economic disparity is mirrored in basic living costs, where the cost of living index for Smolensk stands at 394.94, substantially higher than Homs' index of 45.00, indicating that fundamental goods, services, and housing are significantly more expensive in Russia. While both cities offer relatively affordable car prices, the data reveals clear differences elsewhere, setting the stage for a deeper dive into specific cost factors and quality metrics.
Economically, Smolensk demonstrates far superior financial conditions. Its average net monthly salary stands at $509 USD, a stark contrast to Homs' $73 USD, reflecting a massive difference in purchasing power. Housing costs underscore this economic gap, with a 1-bedroom apartment in Smolensk's city center priced at $346 per month versus just $50 in Homs. Although annual mortgage interest rates are slightly lower in Smolensk (11.9%) than in Homs (14.25%), the absolute property prices tell a different story, with even Smolensk's city center apartment costing $1,463 per square meter, significantly higher than Homs' $50 per square meter, even outside its center.
The gap in quality of life metrics is equally pronounced, particularly concerning safety, healthcare, and environmental factors. Smolensk generally scores higher across these indices, including a Safety Index of 66.87, while comparable data for Homs is unavailable. The city's Health Care Index (53.78) is considerably higher than the average quality of life scores reported for various areas in Homs, which range from a low of 18.53 in Talbisah to a high of 81.23 in An-Nabk. Commuting is less of an issue in Smolensk with a Traffic Commute Time Index of 30.0, whereas pollution levels are slightly lower in Smolensk (57.14) than the average quality of life scores in Homs. While Homs has pockets of relatively good living standards, the overall picture points to Smolensk offering better healthcare access, lower pollution, and a safer environment.
Career opportunities and investment potential differ markedly, largely driven by the underlying economic strength. Smolensk's economy, with a GDP growth rate of 3.6%, significantly outpaces Homs' rate of 0.73%. This robust economic performance supports the higher average net salary ($509 USD) and suggests greater potential for career advancement and savings accumulation compared to the much lower salary in Homs ($73 USD). The lower mortgage interest rate in Smolensk (11.9%) also makes property investment slightly more attractive financially, although the absolute prices are much higher. Conversely, Homs' extremely low GDP per capita ($4,500) indicates limited investment opportunities and fewer career pathways, despite its higher population growth rate (1.67%) compared to Smolensk's (0.49%).
In essence, Smolensk offers a higher standard of living backed by stronger economic fundamentals, higher salaries, and better quality of life metrics, albeit at a much higher cost. Homs presents a scenario of lower expenses and slightly lower borrowing costs but is hampered by a weak economy, very low wages, and potentially less developed public services. The decision between these cities hinges on individual priorities; Smolensk is suited for those prioritizing economic stability and a generally higher quality of life, while Homs might appeal to those seeking extreme budget constraints, though accepting the significant trade-offs in opportunity and living standards.
 Smolensk
 Homs
HomsLocal cuisine & dishes
Smolensk
Homs
 Smolensk
 Homs
HomsTravel & attractions
Smolensk
Homs
Real estate & living comparison
| Smolensk | Homs | |
|---|---|---|
| International Primary School, Annual Tuition per Child | 4646.93 USD | 1000 USD |
| Private Full-Day Preschool or Kindergarten, Monthly Fee per Child | 150 USD | 66.67 USD |
| Jeans (Levi's 501 or Similar) | 62.39 USD | 5 USD |
| Men's Leather Business Shoes | 85.18 USD | 30.76 USD |
| Apples (1 kg) | 1.87 USD | 0.52 USD |
| Bananas (1 kg) | 1.93 USD | 1.24 USD |
| 1 Bedroom Apartment in City Centre | 346.34 USD | 50 USD |
| 1 Bedroom Apartment Outside of City Centre | 230.71 USD | 35 USD |
| Bottled Water (0.33 Liter) | 0.59 USD | 0.5 USD |
| Cappuccino (Regular Size) | 2.61 USD | 0.46 USD |
| Annual Mortgage Interest Rate (20-Year Fixed, in %) | 11.9 USD | 14.25 USD |
| Average Monthly Net Salary (After Tax) | 509.02 USD | 73.07 USD |
| Cinema Ticket (International Release) | 4.73 USD | 5 USD |
| Monthly Fitness Club Membership | 41.14 USD | 10 USD |
| Gasoline (1 Liter) | 0.8 USD | 1 USD |
| Monthly Public Transport Pass (Regular Price) | 10 USD | 15 USD |
| Basic Utilities for 85 m2 Apartment (Electricity, Heating, Cooling, Water, Garbage) | 70 USD | 100 USD |
| Broadband Internet (Unlimited Data, 60 Mbps or Higher) | 9.04 USD | 55 USD |
| Population | 312,896 | 775,404 |
Last updated: 2026-04-05T11:39:48+00:00
Comments for this comparison