Austin vs. Yenagoa: Detailed 2026 Cost of Living & Quality Comparison
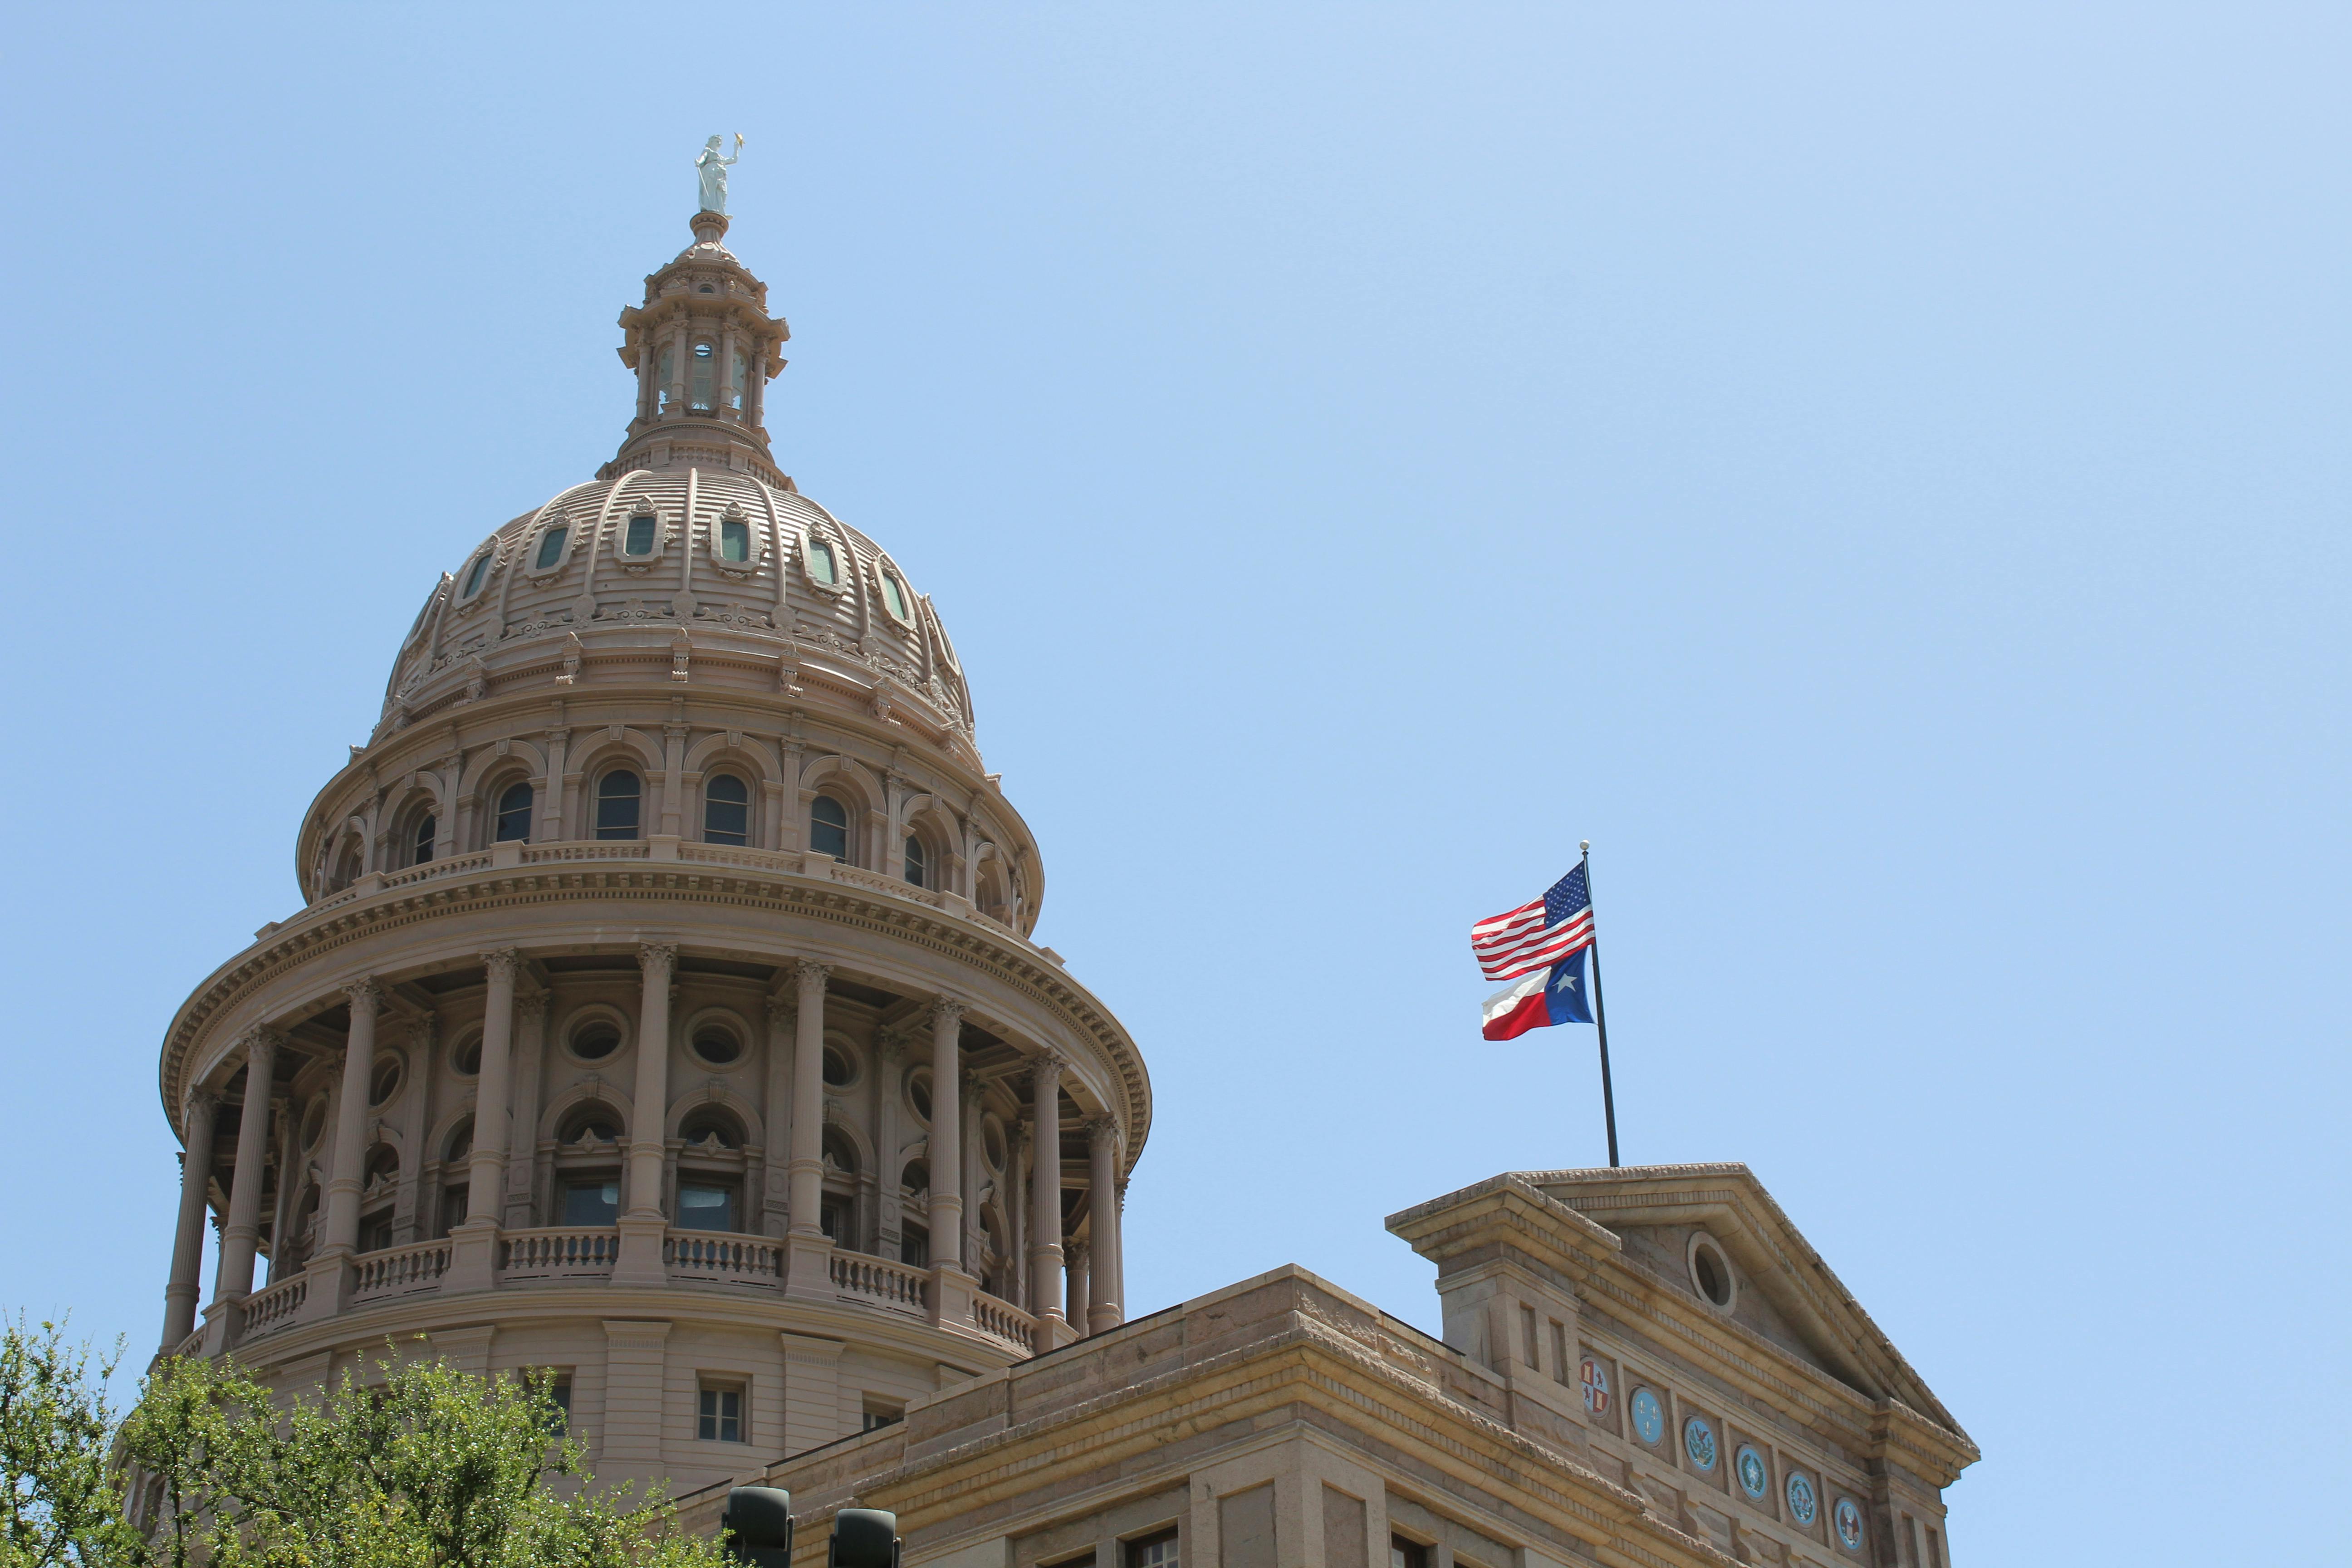 Austin
Image by:Ruben Reyes
Austin
Image by:Ruben Reyes
 Yenagoa
Image by:Taiwo Samson,,
Yenagoa
Image by:Taiwo Samson,,
Austin operates within a vastly different economic reality than Yenagoa. In 2026, Austin's robust economy is reflected in its significantly higher GDP per capita of $74,600, nearly thirteen times that of Yenagoa's $5,600. This economic strength translates into higher salaries, with Austin offering an average monthly net salary of $4,916.91, a figure likely much higher than what would be found in Yenagoa, although specific data for the latter is lacking. However, this economic prosperity comes with a substantial cost of living. A 1-bedroom apartment in Austin's city center averages $2,111.76 per month, a stark contrast to the $281.58 found in Yenagoa's center. Similarly, a 3-bedroom apartment in Austin averages $3,958.57, compared to $762.61 in Yenagoa, and property prices in the city center reach $7,259.06 per square meter, far exceeding Yenagoa's $111.32 per square meter.
The gap between these cities extends into the realm of quality of life, particularly concerning safety, healthcare, and climate. Austin generally scores higher across these crucial areas. Its Safety index is 56.01, a figure not available for Yenagoa but suggesting a safer environment. Healthcare in Austin scores 64.9, again a benchmark lacking for Yenagoa but indicating better access or quality. Austin's Climate index is 82.08, also superior to the unspecified figures for Yenagoa. Furthermore, Austin's Purchasing Power Index is 174.64, significantly higher than the implied lower purchasing power in Nigeria, while its Cost of Living Index is lower at 67.15 compared to the higher indices sometimes cited for Nigerian regions like Calabar (301.62). Despite these advantages, Austin faces challenges, including longer commute times averaging 40.48 minutes and higher pollution levels at 43.06, compared to the unknown figures for Yenagoa.
While the data for Yenagoa presents a picture of significantly lower costs and potentially different economic pressures, direct comparisons are hampered by the lack of specific indices for the city itself. Yenagoa's GDP growth rate of 2.86% is slightly higher than Austin's 2.89%, and its population growth rate is 2.52%, compared to Austin's 0.67%. However, the vastly lower GDP per capita ($5,600) and the much lower property prices ($111.32/m²) underscore the fundamentally different economic context. The lower cost of living in Yenagoa, particularly for housing ($281.58 for a 1-bed apartment), makes it substantially more affordable than Austin ($2,111.76), but this comes with the trade-offs inherent in a developing economy, potentially impacting long-term stability and the quality of essential services like healthcare and safety, which Austin's data suggests are generally superior.
 Austin
 Yenagoa
Local cuisine & dishes
Austin
Yenagoa
 Austin
 Yenagoa
Travel & attractions
Austin
Yenagoa
Real estate & living comparison
| Austin | Yenagoa | |
|---|---|---|
| 1 Bedroom Apartment in City Centre | 2111.76 USD | 281.58 USD |
| 1 Bedroom Apartment Outside of City Centre | 1365.59 USD | 187.72 USD |
| Bottled Water (0.33 Liter) | 2.24 USD | 0.2 USD |
| Cappuccino (Regular Size) | 5.39 USD | 1 USD |
| GDP Growth Rate: | 2.89 USD | 2.86 USD |
| GDP Per Capita ($) : | 74600 USD | 5600 USD |
| Population | 1,915,031 | 0 |
Last updated: 2026-04-05T17:43:08+00:00
Comments for this comparison