Bamenda vs. Samarinda: Detailed 2026 Cost of Living & Quality Comparison
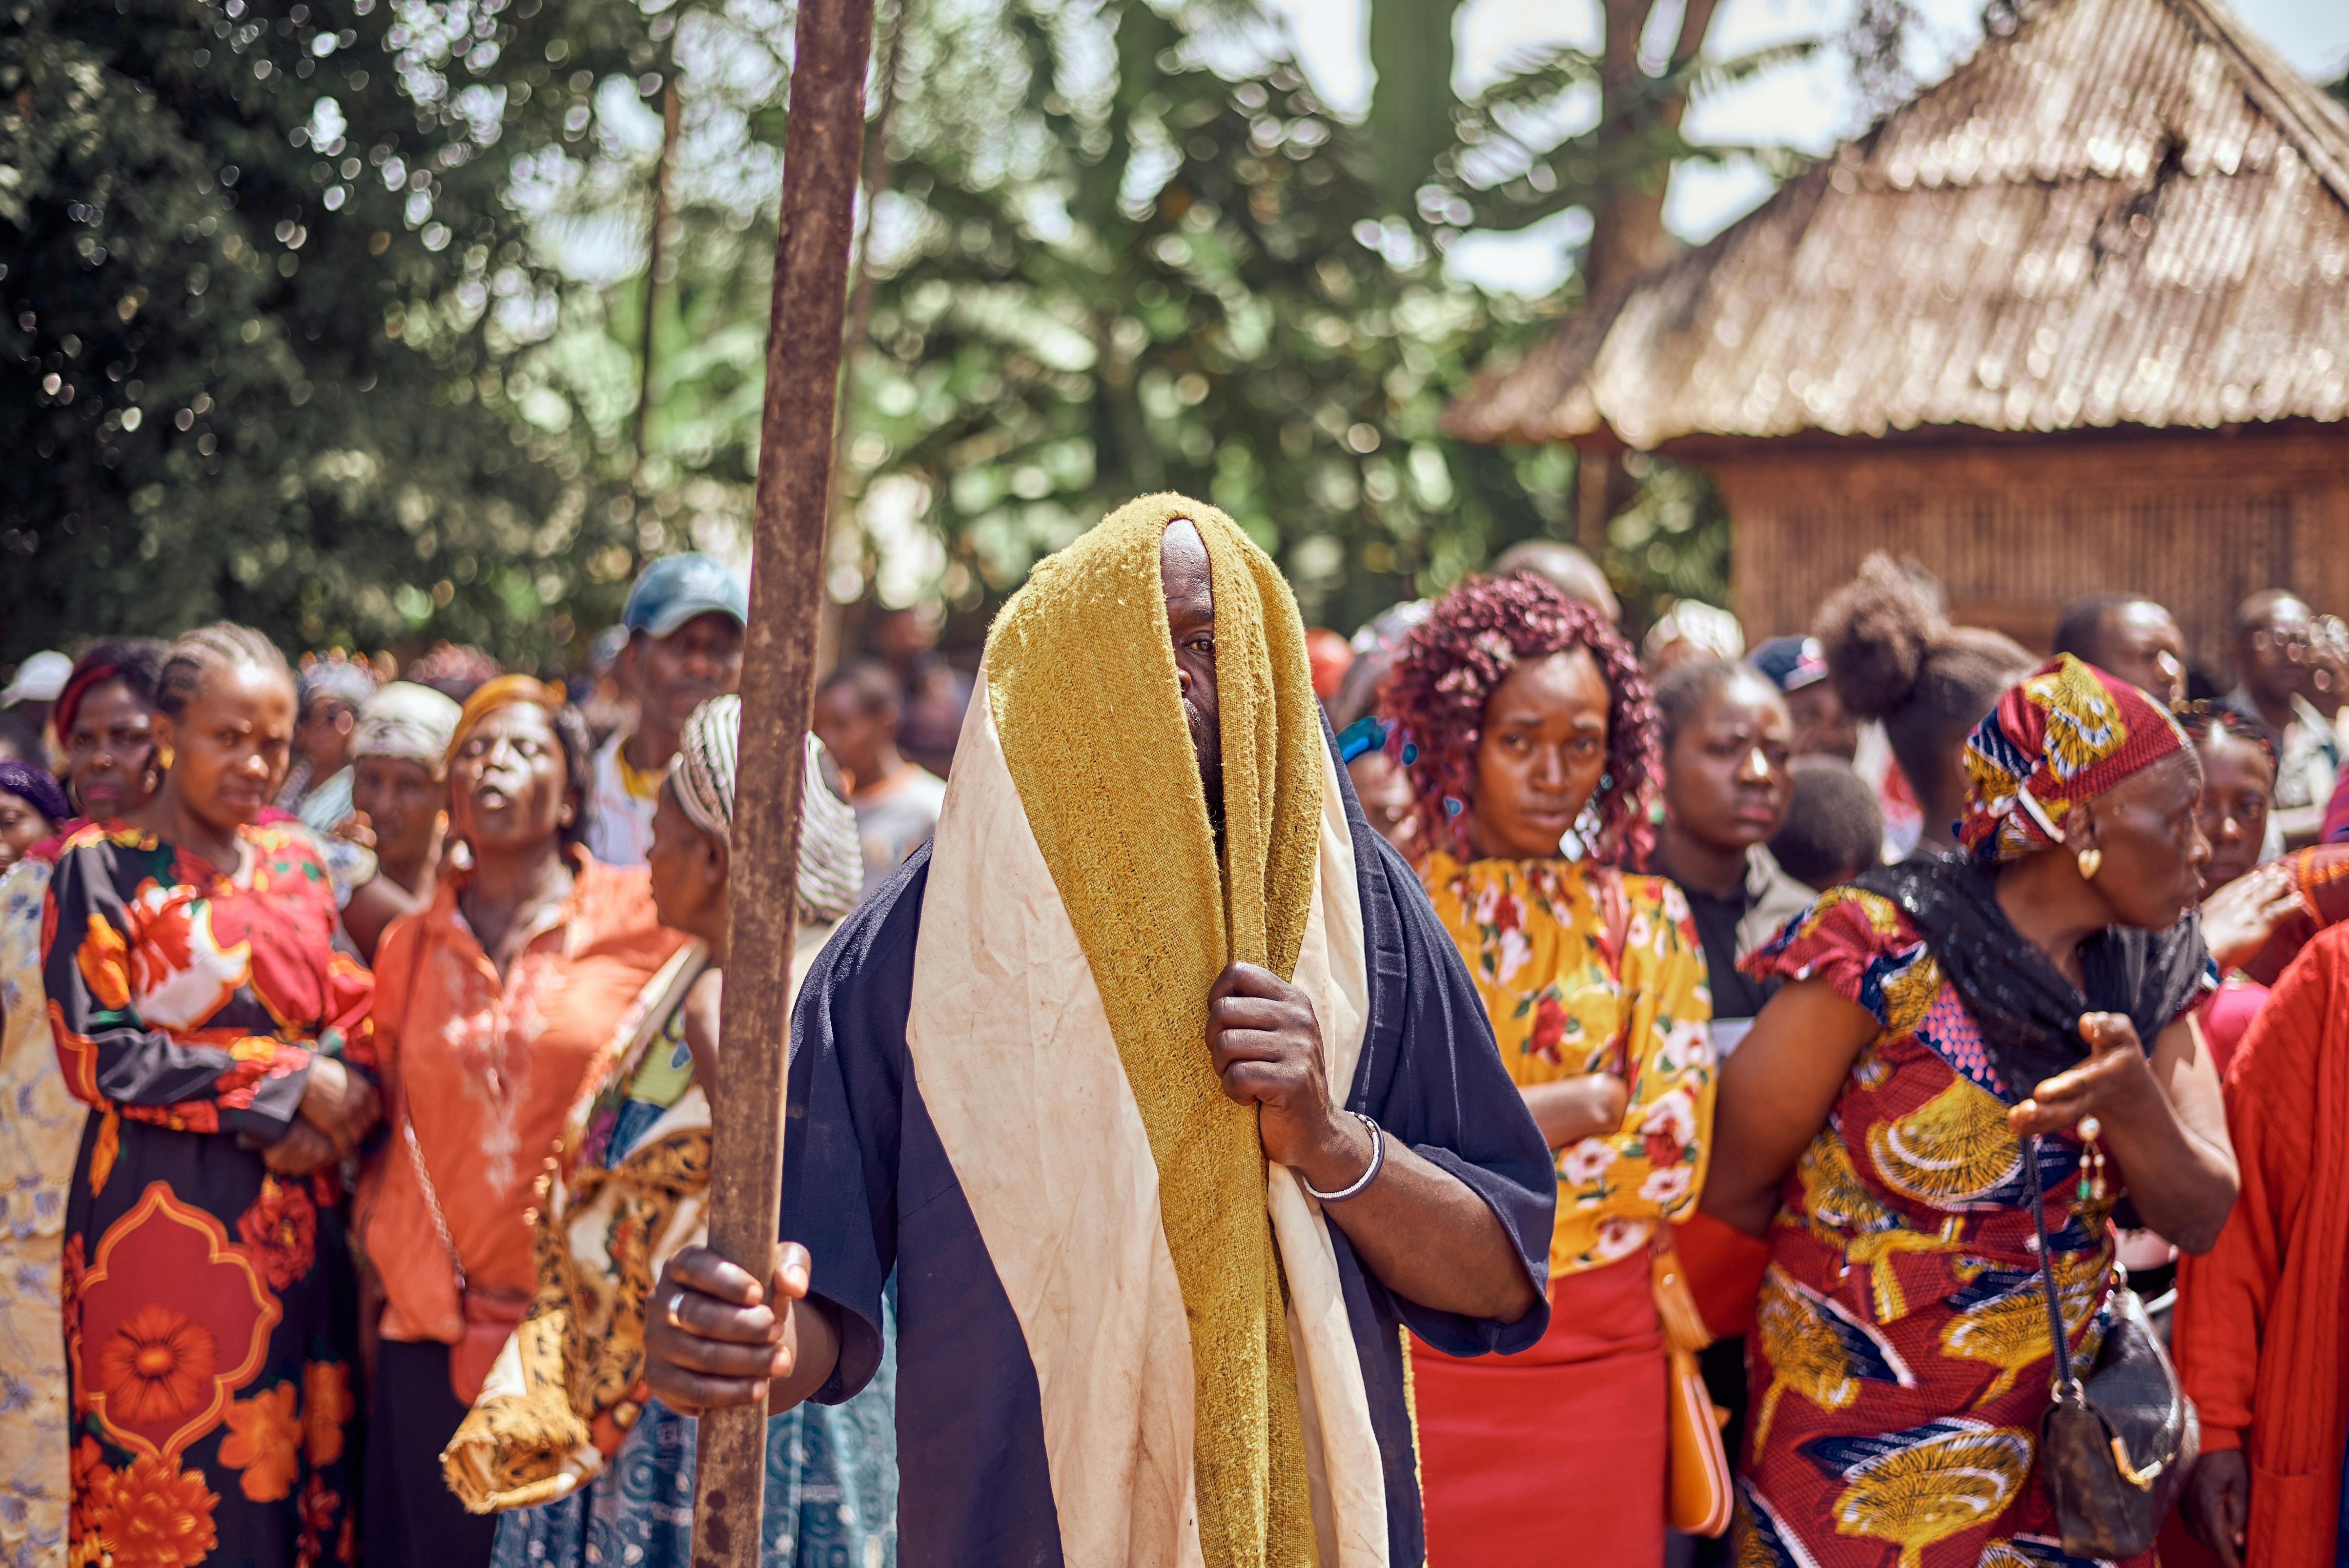 Bamenda
Image by:Xavier Messina
Bamenda
Image by:Xavier Messina
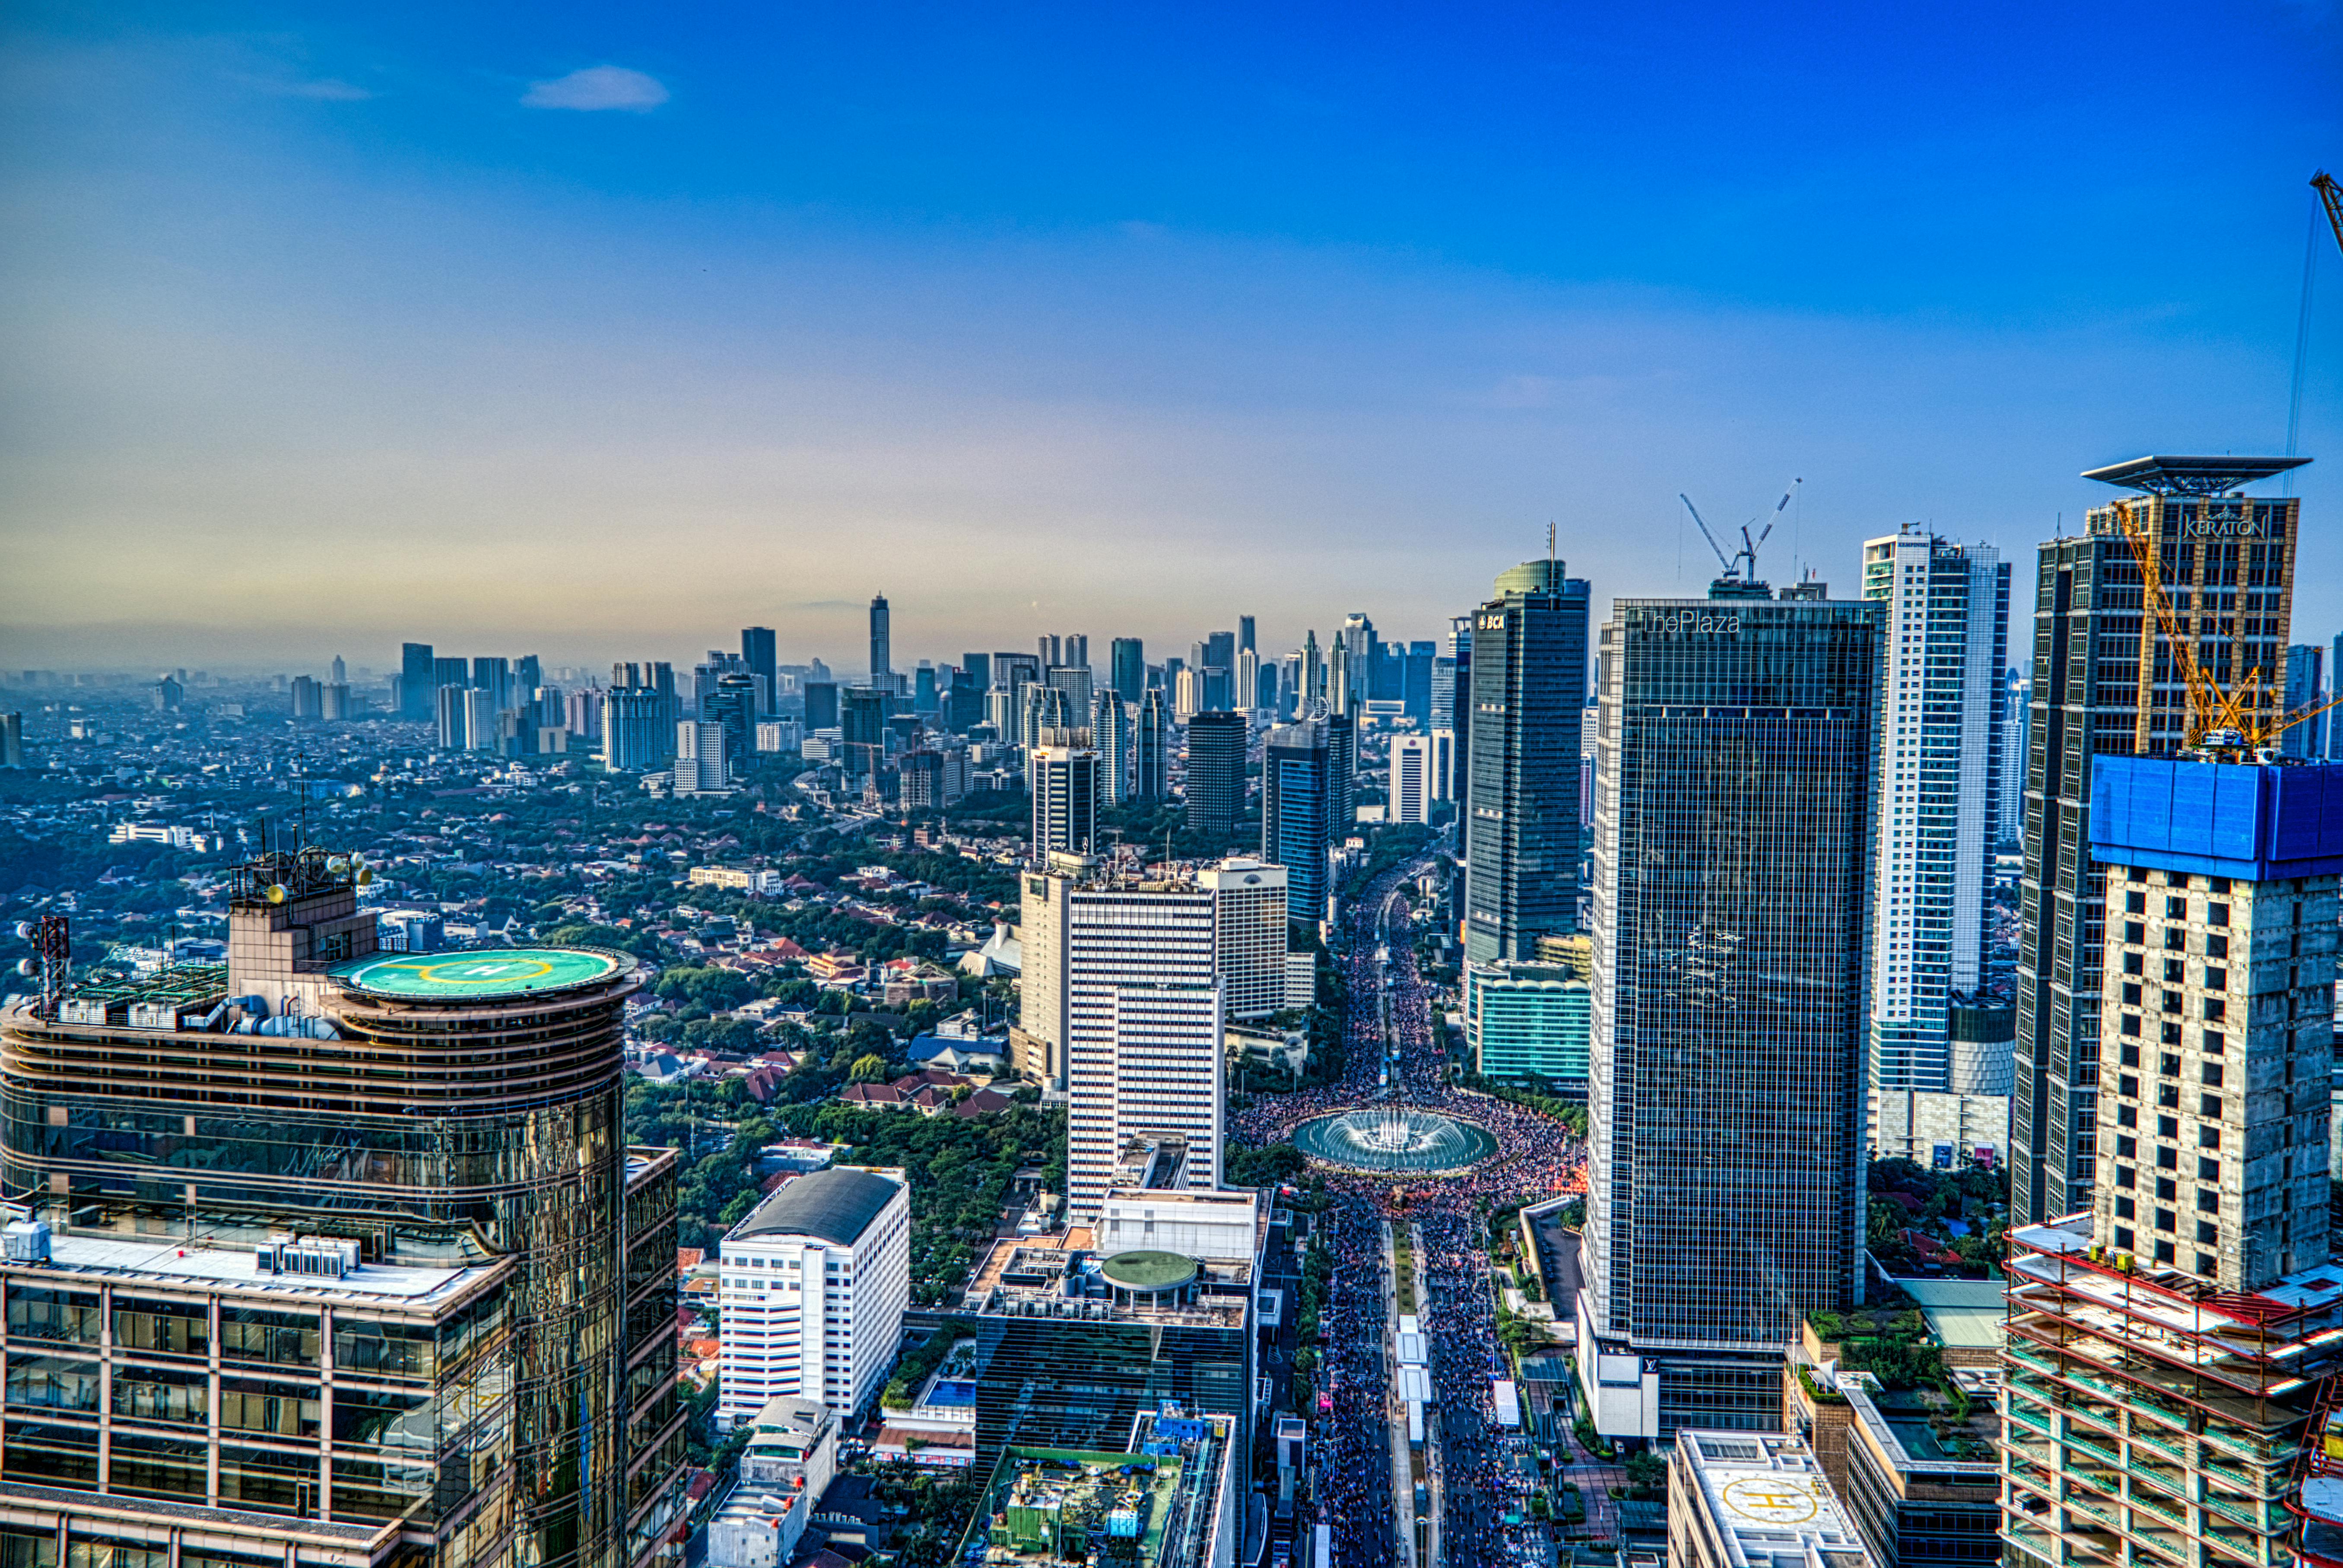 Samarinda
Image by:Tom Fisk
Samarinda
Image by:Tom Fisk
Bamenda presents a significantly more affordable option compared to Samarinda, reflecting a stark difference in overall cost structures for 2026. Basic goods, food, transportation, utilities, and housing costs are substantially lower in Bamenda than in Samarinda. This affordability extends to salaries, with the average net income in Bamenda being a mere $89 per month, a figure dwarfed by the $3,511 average net salary found in Samarinda. While housing affordability in Bamenda varies based on property type, ranging from $50.4 to $247.96 per month, the data suggests lower overall housing expenses than typically found in a city like Samarinda, despite the latter having a higher mortgage interest rate of 11.59%. Transportation costs also favour Bamenda, featuring lower fuel prices and public transport fares, although specific taxi data for the city was unavailable for direct comparison.
The economic profiles of the two cities diverge markedly, with Samarinda exhibiting significantly higher income potential and faster economic expansion. In 2026, Samarinda's GDP per capita stands at $13,900, more than double that of Bamenda's $4,900, and its GDP growth rate is slightly higher at 5.05% compared to Bamenda's 3.25%. This economic dynamism translates directly into the salary differential already noted. Conversely, Bamenda's population growth rate of 2.71% suggests continued expansion, while Samarinda's rate of 0.73% indicates a more stable or potentially slowing population increase. These figures paint Samarinda as the economically more vibrant city, likely offering more diverse job opportunities and higher earning potential, though at a much greater cost of living.
Assessing quality of life presents challenges due to differing data availability. Bamenda lacks specific indices for safety, health, or pollution, relying instead on property price data, which doesn't directly measure quality of life. Samarinda provides indices for safety (75/100), healthcare (36.11/100), commute time (25/100), and pollution (35.63/100). While the relatively high safety index might be favourable, the low healthcare index and moderate pollution score could indicate potential concerns regarding access to quality healthcare services and environmental conditions. Bamenda's property price data might indirectly suggest certain areas are preferred, but without standardized quality metrics, direct comparisons remain difficult. Access to services like mid-range dining or cinema is available, but these are cheaper in Bamenda ($6.24 for a restaurant meal, compared to $11.85 in Samarinda), though cinema ticket prices in Bamenda are not provided for direct comparison.
Samarinda's superior economic indicators point towards better investment and career prospects for 2026. With a higher GDP per capita, faster growth rate, and significantly higher average net salary ($3,511 vs. $89), the city offers a compelling case for those prioritizing professional advancement and financial security. The higher salaries in Samarinda likely support the city's higher cost of living, including more expensive housing options compared to the lower-cost properties seen in Bamenda. However, the data also highlights a substantial housing gap, with property prices in Bamenda being considerably lower than the implied cost in Samarinda, suggesting potential real estate opportunities, but these must be weighed against the much lower income base.
Ultimately, the choice between Bamenda and Samarinda hinges on individual priorities and circumstances. Bamenda offers a substantially lower cost of living, potentially more affordable housing, and a lower average salary, making it suitable for individuals or families prioritizing minimal expenses or seeking a more affordable lifestyle. However, it presents challenges regarding standardized quality of life data and potentially slower economic growth. Samarinda, while having a higher cost of living and average salary, offers potentially better economic prospects, higher earning potential, and more developed infrastructure, albeit with possible limitations in healthcare access and environmental quality. The decision requires weighing the trade-offs between cost savings and potential career growth, quality of life factors, and the overall economic environment.
 Bamenda
 Samarinda
Local cuisine & dishes
Bamenda
Samarinda
 Bamenda
 Samarinda
Travel & attractions
Bamenda
Samarinda
Real estate & living comparison
| Bamenda | Samarinda | |
|---|---|---|
| Apples (1 kg) | 2.23 USD | 5.43 USD |
| Bananas (1 kg) | 0.89 USD | 1.19 USD |
| Bottled Water (0.33 Liter) | 0.48 USD | 0.39 USD |
| Cappuccino (Regular Size) | 0.89 USD | 1.48 USD |
| Average Monthly Net Salary (After Tax) | 105.85 USD | 351.19 USD |
| GDP Growth Rate: | 3.25 USD | 5.05 USD |
| Monthly Fitness Club Membership | 8.91 USD | 14.82 USD |
| Gasoline (1 Liter) | 1.41 USD | 0.59 USD |
| Taxi 1 Hour Waiting (Standard Tariff) | 6.24 USD | 5.93 USD |
| Broadband Internet (Unlimited Data, 60 Mbps or Higher) | 34.74 USD | 59.27 USD |
| Population | 600,000 | 831,460 |
Last updated: 2026-04-05T11:38:55+00:00
Comments for this comparison