Gombe vs. Panipat: Detailed 2026 Cost of Living & Quality Comparison
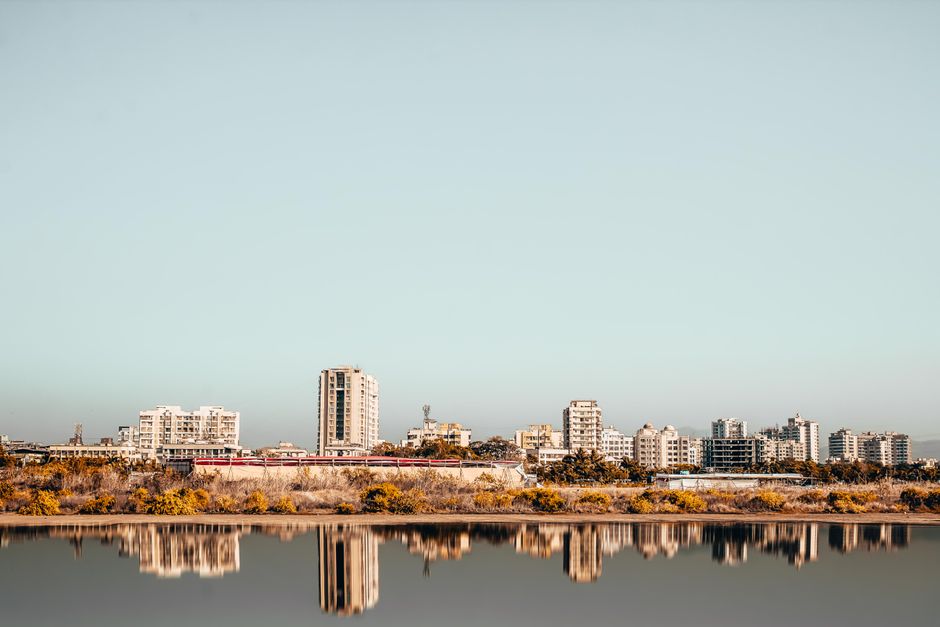
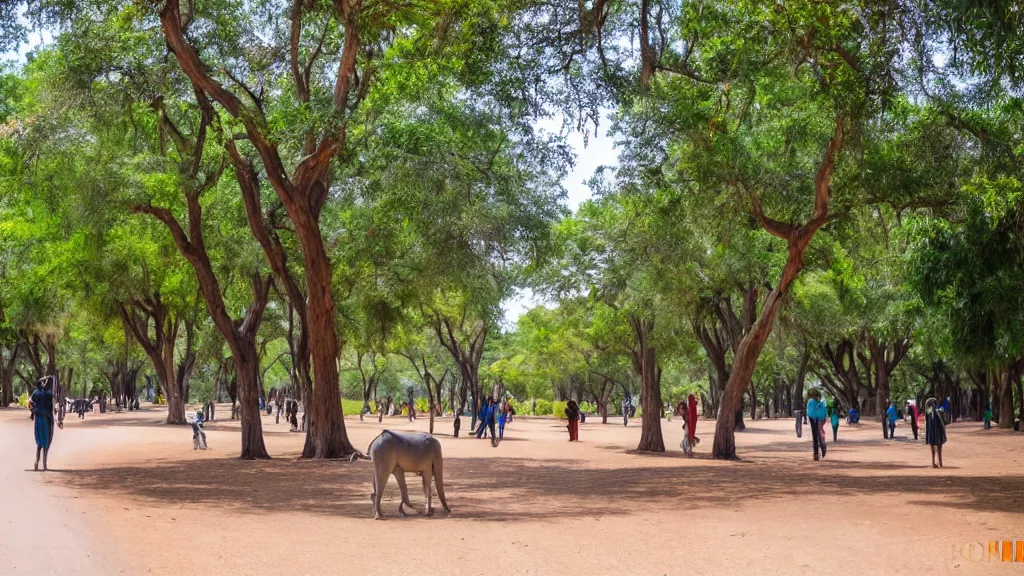
 Gombe
Image by:Aisa Zerubabel
Gombe
Image by:Aisa Zerubabel
 Panipat
Image by:Rizwan Sayyed,,
Panipat
Image by:Rizwan Sayyed,,
Panipat presents a far more detailed and quantifiable picture for potential residents or investors than Gombe. Its economic indicators, such as a higher GDP per capita ($9200.0) and significantly faster growth rate (8.15%), suggest a more dynamic environment. Panipat's housing market is also defined, with clear apartment prices ranging from $924.75 to $1604.71 per square meter depending on location, and corresponding rent levels from $61.65 to $348.14 per month for different apartment sizes. In contrast, Gombe's economic data, while showing a lower GDP per capita ($5600.0) and slower growth (2.86%), lacks the granular detail found in Panipat's figures, making direct comparisons challenging. Furthermore, Gombe's specific housing costs are absent, relying instead on regional Nigerian comparisons ($280.86-$311.8) that don't reflect city-level specifics.
The gap in data extends significantly into the quality of life assessment. Panipat offers a specific quality of life index (76.48) and breakdowns, revealing a concerning safety index of 23.6 and a healthcare index of 68.52, alongside a high pollution reading of 75.96. Commute times are also quantified via an index of 47.0. Gombe, however, provides no direct quality of life metrics for its own residents; its figures relate only to other Nigerian cities like Jos or Maiduguri, leaving a major void in understanding the lived experience for those in Gombe itself.
Panipat demonstrates superior investment and career potential based on available data. Its higher GDP per capita, faster economic expansion, and lower cost of living index (18.05) compared to other Indian locations point towards better prospects. The average net salary, though lower than the GDP per capita, is $250.23 monthly. Gombe's data, while including GDP figures ($5600.0) and growth rate (2.86%), offers no insights into employment opportunities or the investment climate, making it impossible to gauge its job market or investment potential with the same confidence as Panipat's figures suggest.
While Panipat's data allows for a sharper analysis, its quality of life profile presents mixed signals. The high pollution score and notably low safety index raise concerns about the daily living environment. Healthcare access, indicated by the 68.52 index, appears adequate but perhaps not world-class. Gombe, despite the lack of direct quality metrics, might offer a less immediately apparent downside in terms of environmental factors based on the limited data available, though this remains speculative.
Ultimately, Panipat emerges as the city with the more accessible and comprehensive dataset for evaluating cost of living, housing, quality of life, and economic prospects in 2026. Its higher income potential, faster growth, and defined housing market, despite some quality of life concerns, paint a picture of a more developed and measurable environment. Gombe, conversely, offers lower economic figures and potentially lower living costs but provides far less specific information, making a confident assessment of its advantages or drawbacks considerably harder.
 Gombe
Gombe Panipat
Local cuisine & dishes
Gombe
Panipat
 Gombe
Gombe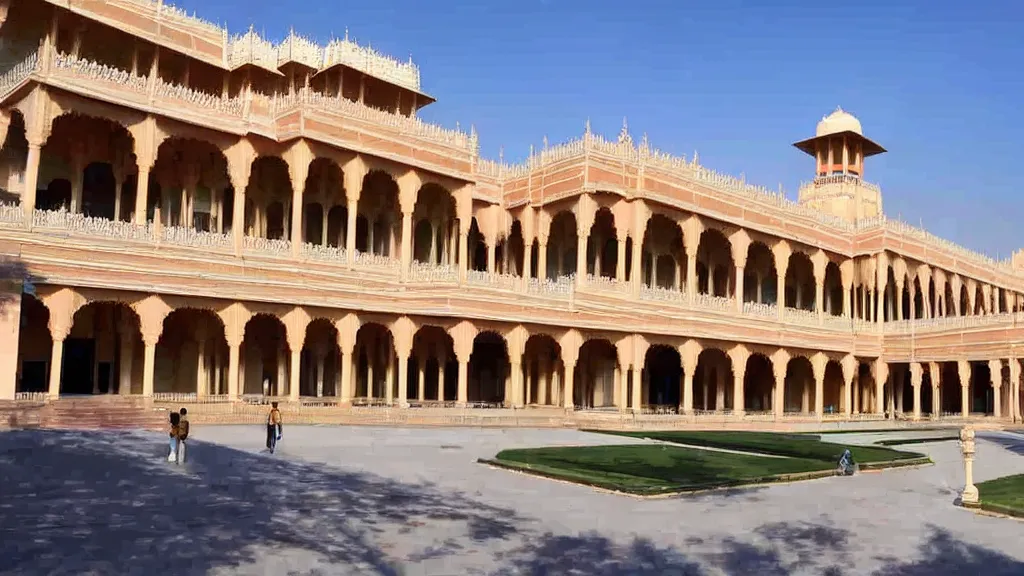 Panipat
Travel & attractions
Gombe
Panipat
Real estate & living comparison
| Gombe | Panipat | |
|---|---|---|
| Apples (1 kg) | 0.87 USD | 1.8 USD |
| Bananas (1 kg) | 0.58 USD | 0.72 USD |
| Bottled Water (0.33 Liter) | 0.09 USD | 0.12 USD |
| Combo Meal at McDonald's (or Equivalent Fast-Food Meal) | 1.31 USD | 3.26 USD |
| GDP Growth Rate: | 2.86 USD | 8.15 USD |
| GDP Per Capita ($) : | 5600 USD | 9200 USD |
| Monthly Public Transport Pass (Regular Price) | 5.45 USD | 10.88 USD |
| One-Way Ticket (Local Transport) | 0.11 USD | 0.87 USD |
| Population | 0 | 1,202,811 |
Last updated: 2026-04-05T17:38:17+00:00
Comments for this comparison