Rome vs. Shibin al Kawm: Detailed 2026 Cost of Living & Quality Comparison
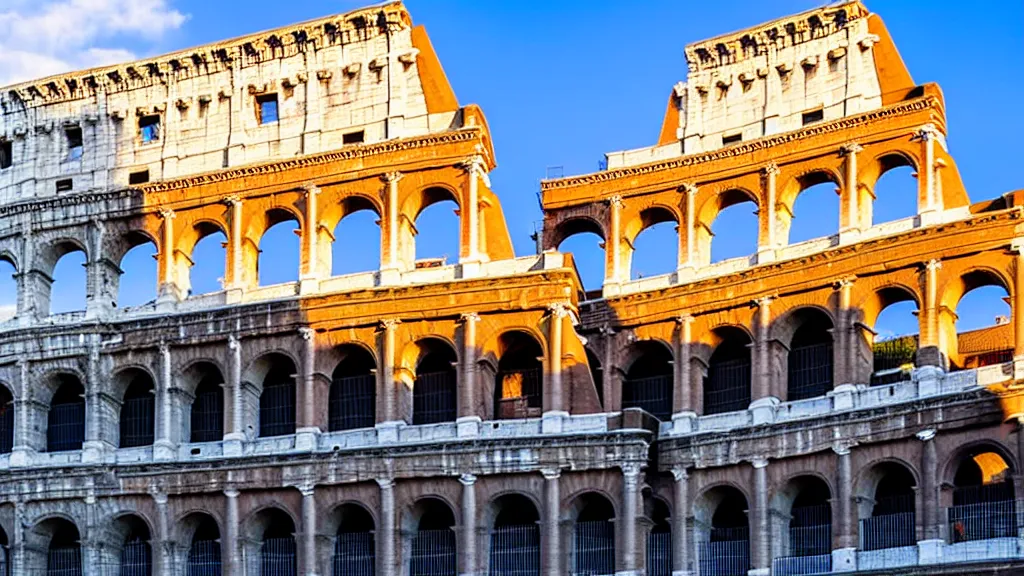
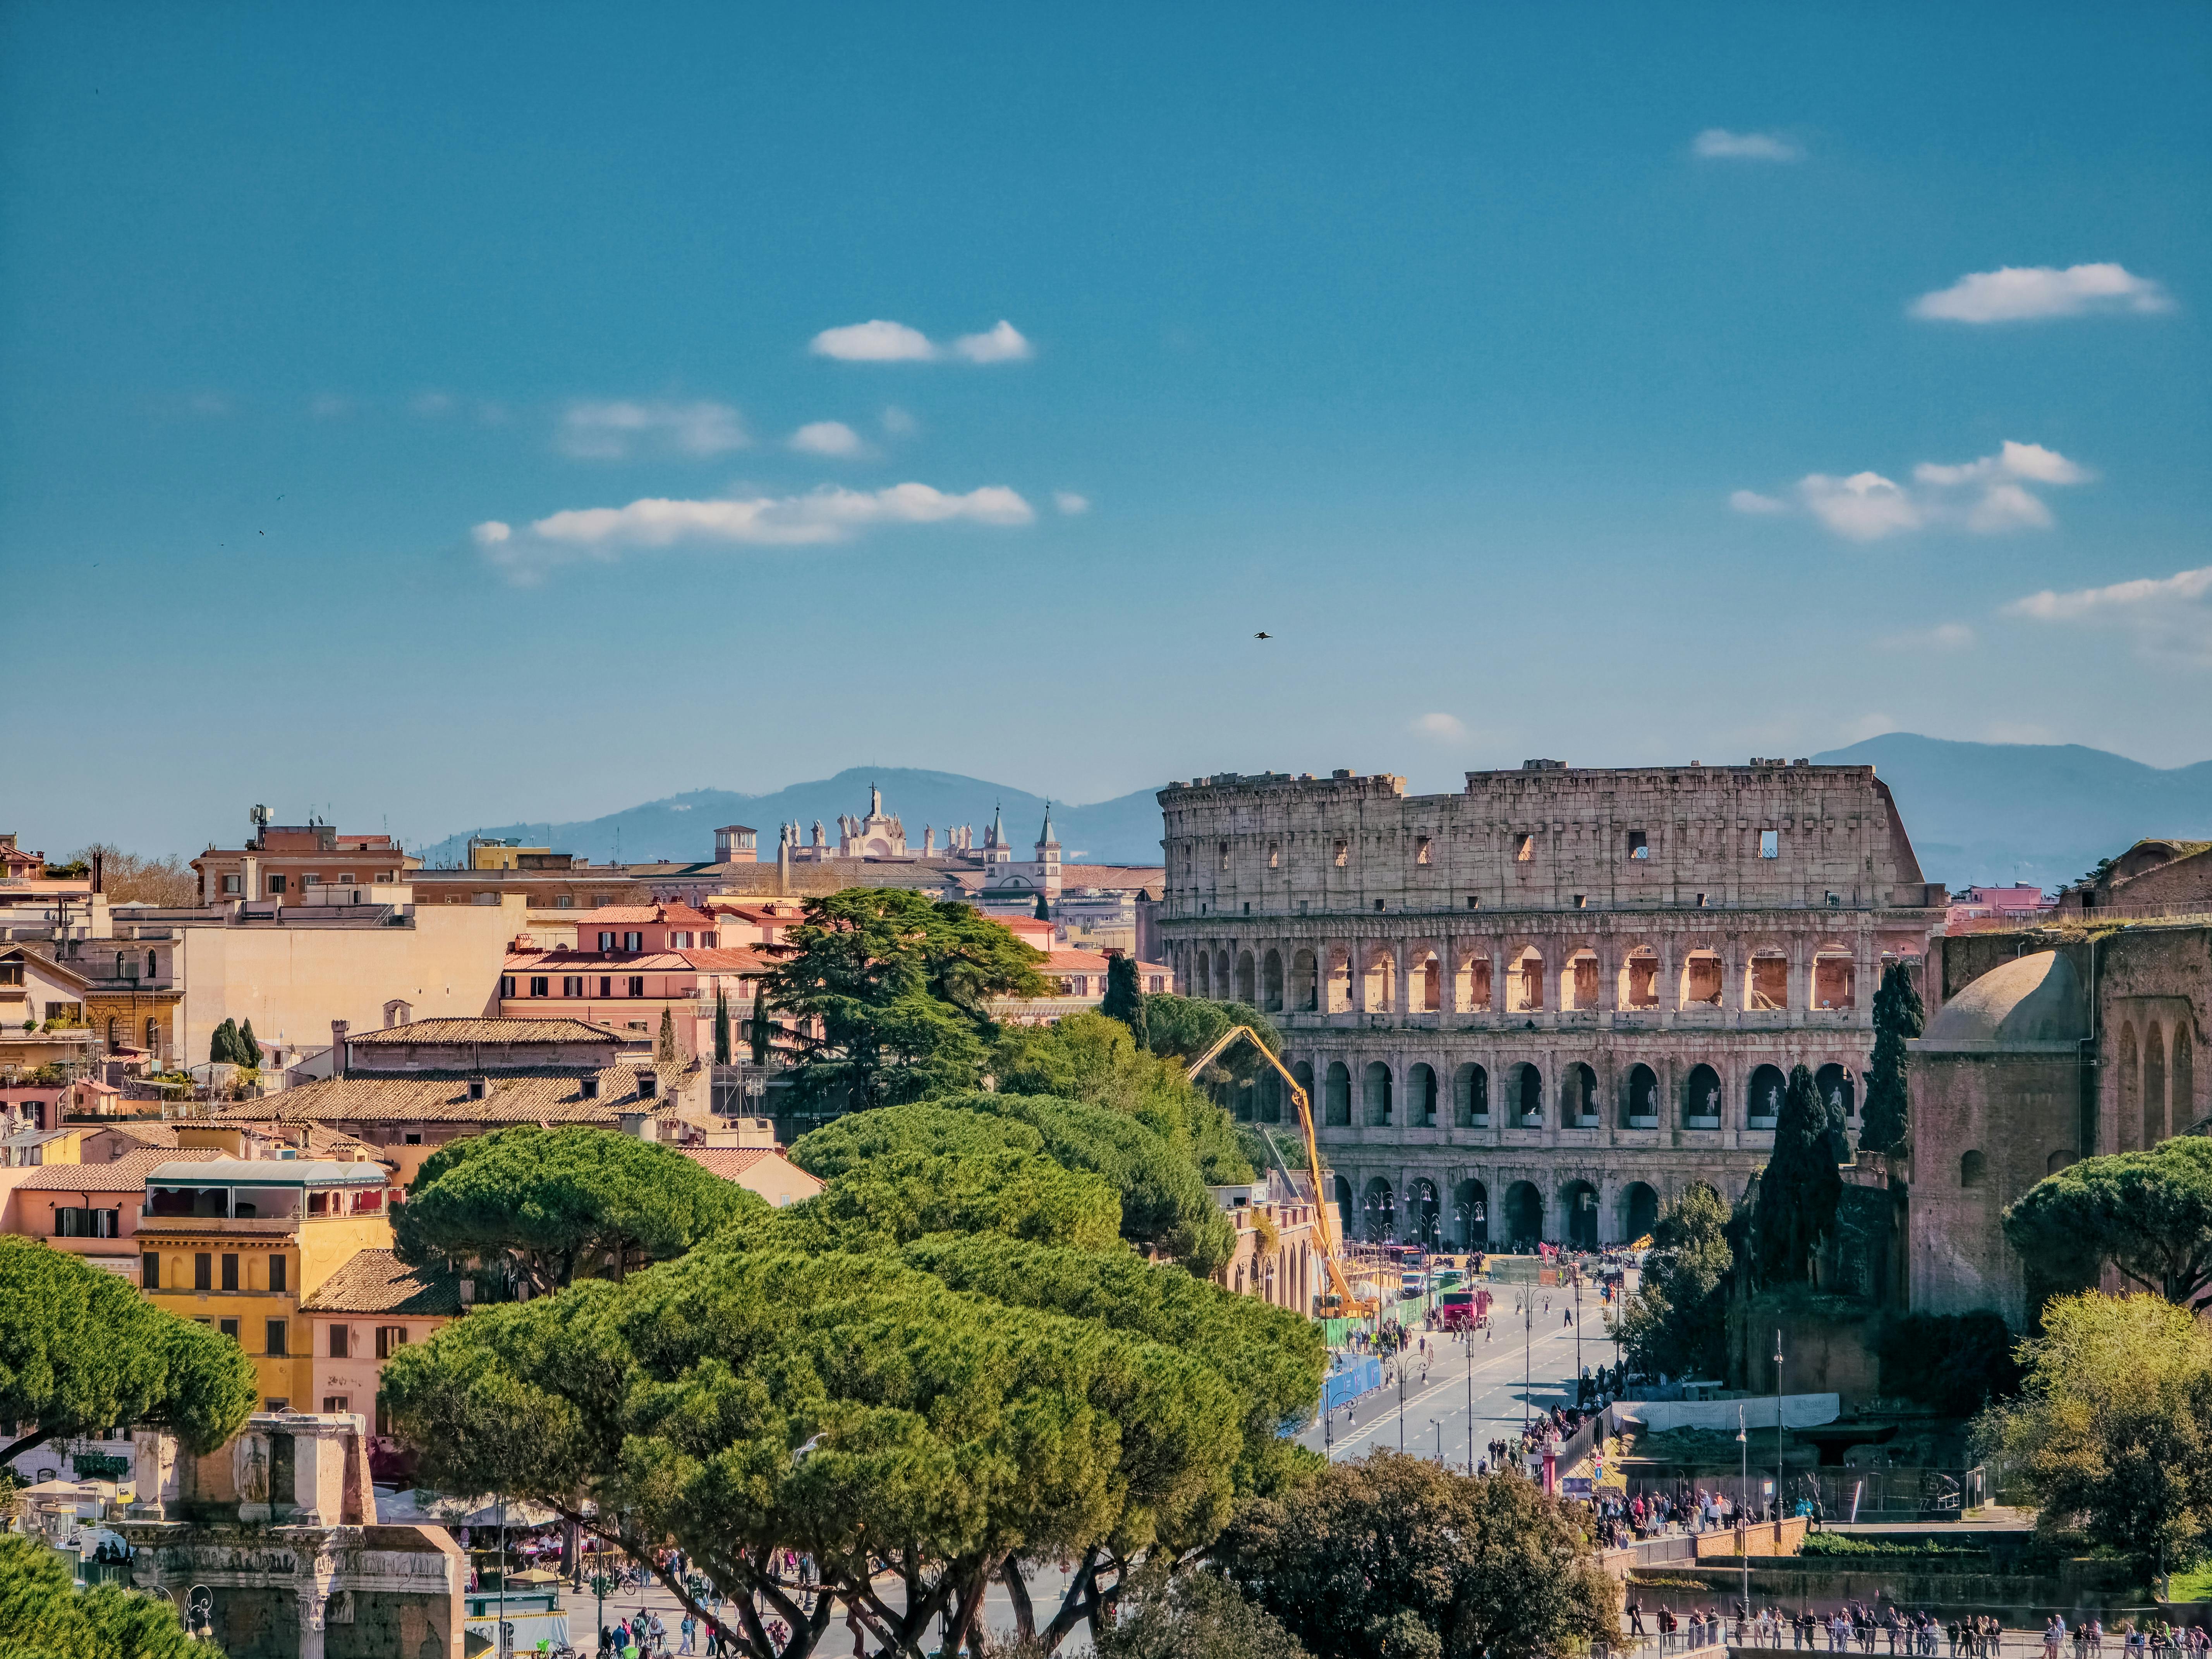 Rome
Image by:Paolo Bici
Rome
Image by:Paolo Bici
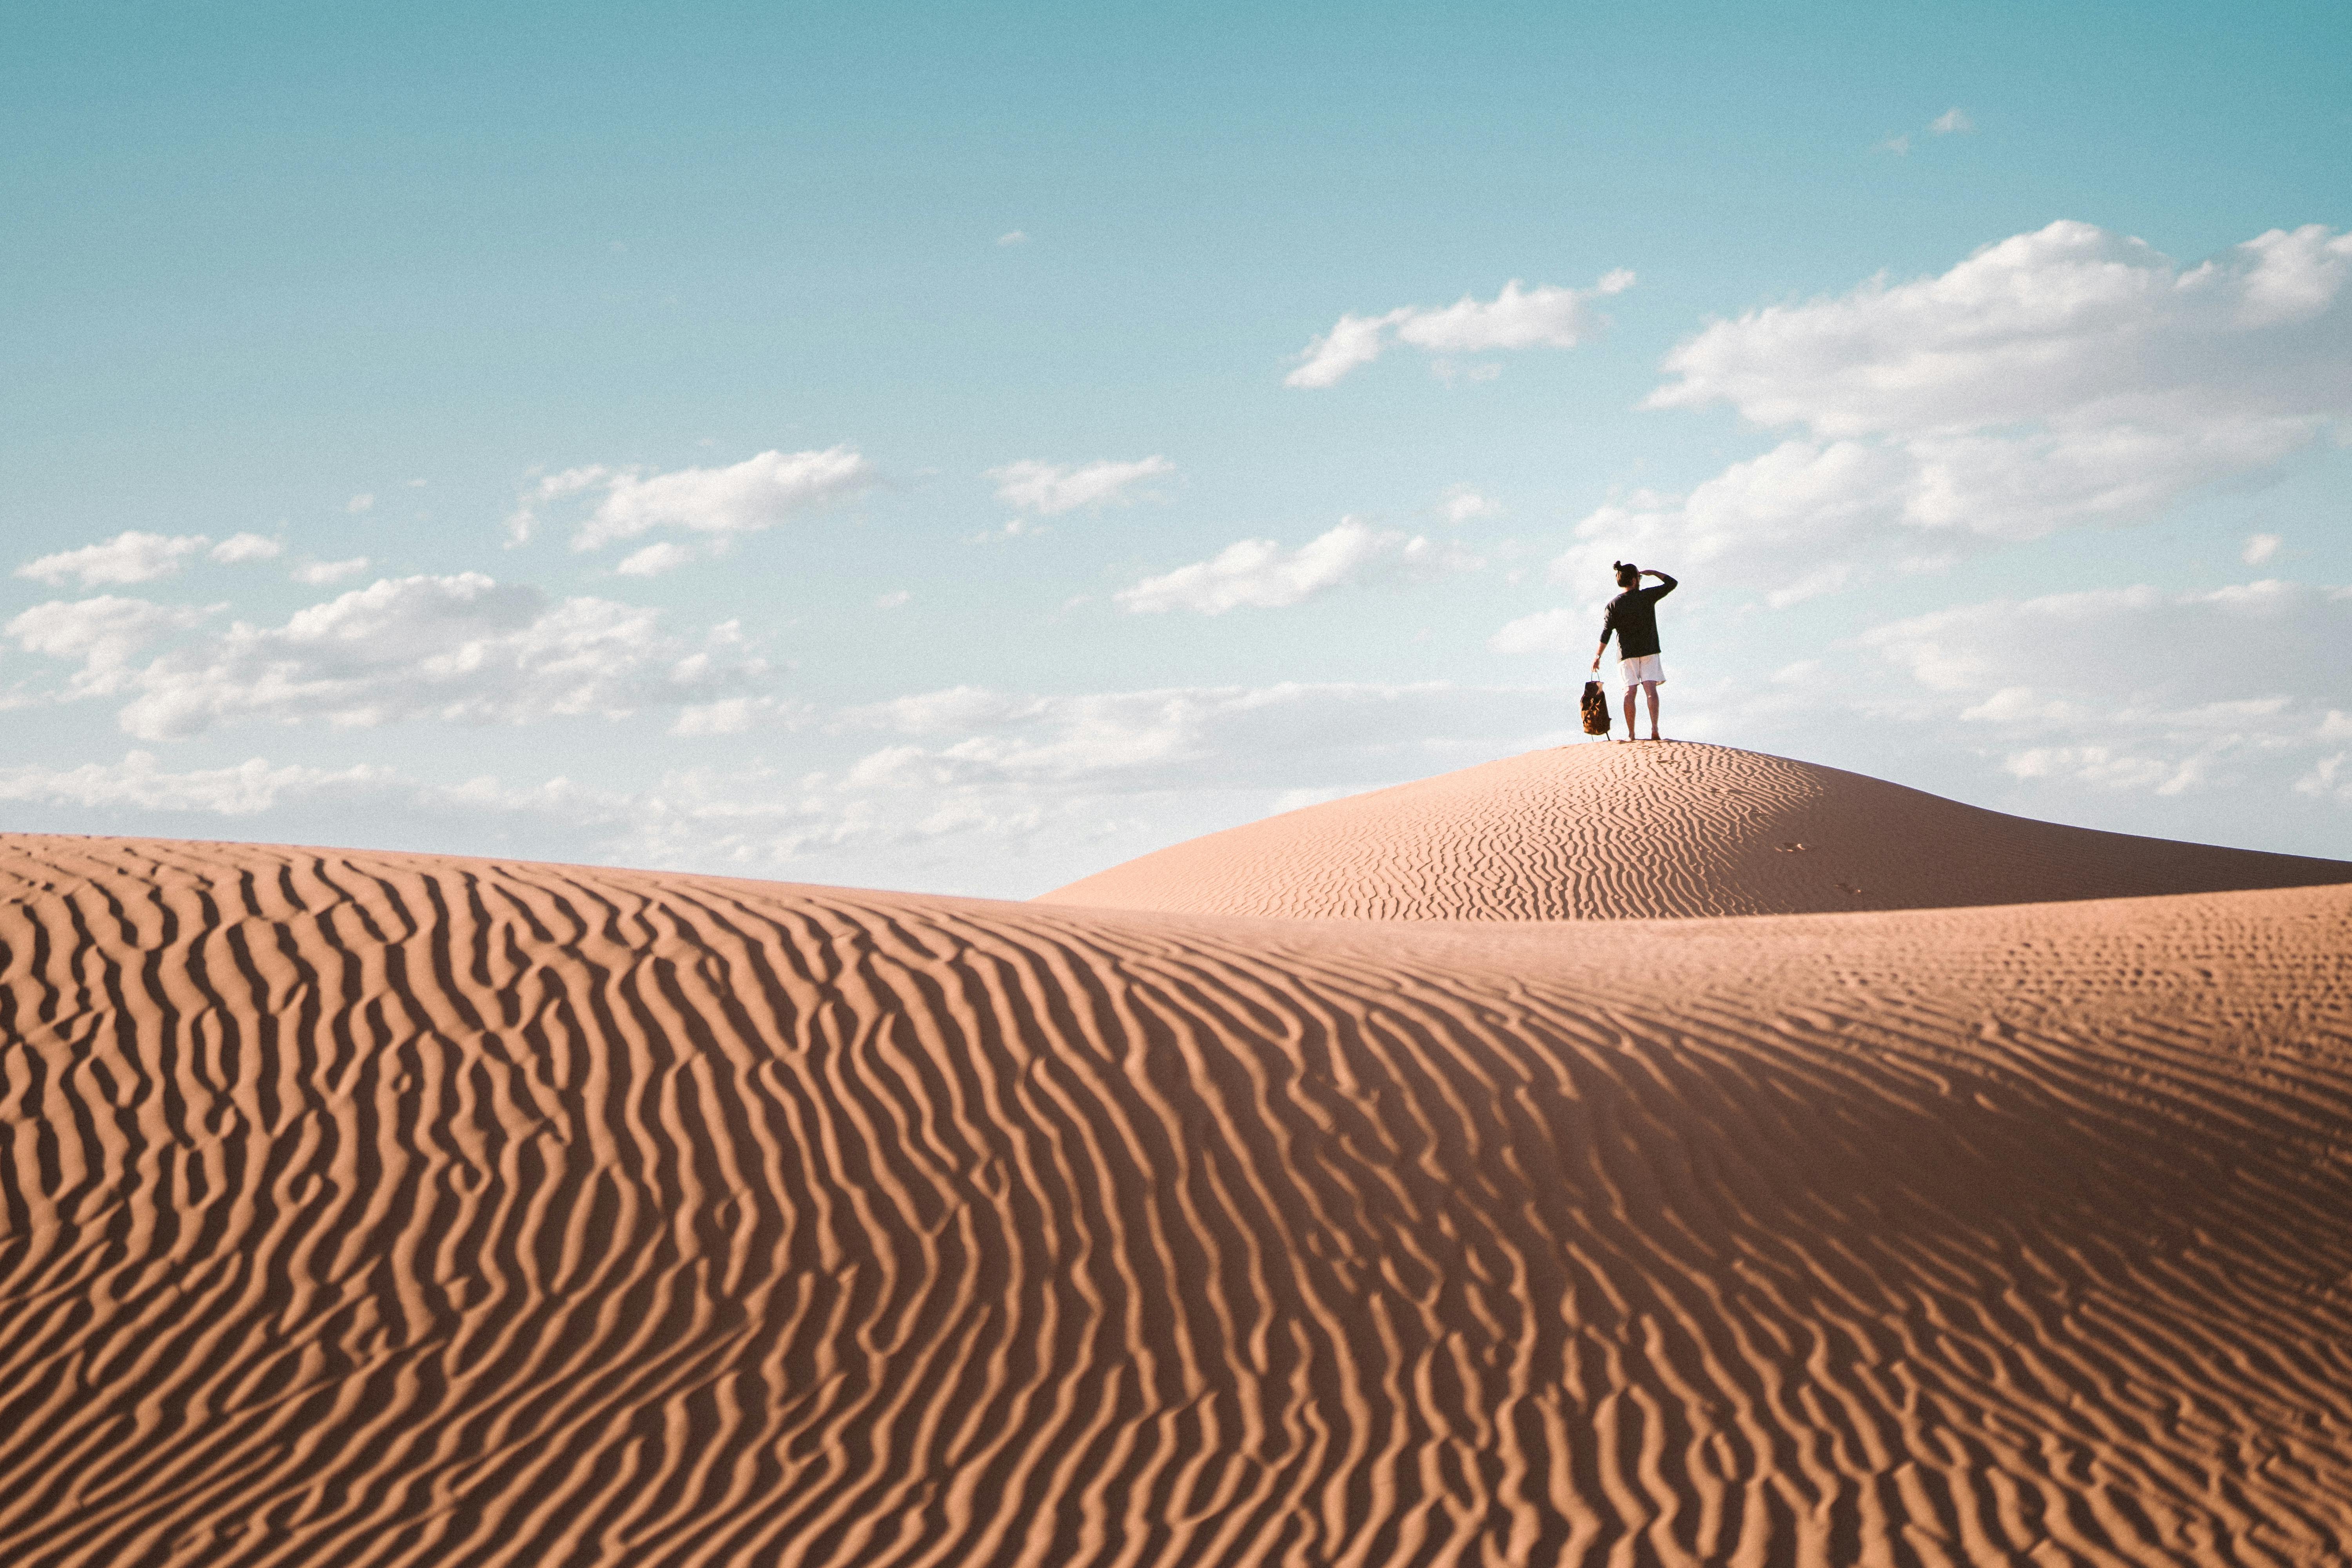 Shibin al Kawm
Image by:Taryn Elliott
Shibin al Kawm
Image by:Taryn Elliott
Rome and Shibin al Kawm present fundamentally different urban experiences in 2026, distinguished primarily by their cost structures and quality metrics. Rome, a sprawling European capital with a population exceeding two and a half million, commands significantly higher expenses across most daily living categories compared to the smaller Egyptian city of Shibin al Kawm, home to around 268,000 residents. This disparity reflects Rome's status as a major financial, cultural, and tourist hub, whereas Shibin al Kawm operates within a developing economy. While Rome generally offers superior infrastructure and services, these advantages come at a substantial financial cost, creating a clear economic divide between the two locations.
The cost of living in Shibin al Kawm is substantially lower than in Rome, making it considerably more affordable for residents. This advantage is evident across fundamental daily expenses: basic groceries, inexpensive meals, public transportation fares, fuel, and even cinema tickets all cost significantly less in Shibin al Kawm. Standard apartment utilities are also much more affordable there. However, one specific item bucks this trend: the annual tuition for an international primary school is slightly higher in Shibin al Kawm than in Rome. Despite this single exception, the overall affordability of basic necessities in Shibin al Kawm is a defining characteristic, contrasting sharply with Rome's high expenditure requirements.
Housing represents a stark illustration of the economic gap between these cities. Property prices, whether for renting or buying, are considerably more expensive in Rome than in Shibin al Kawm. This high cost of real estate is a major component of the overall higher cost of living in the Italian capital. Conversely, Shibin al Kawm offers significantly more accessible housing options. Furthermore, the economic profiles differ markedly: Rome boasts a much higher GDP per capita, indicating a stronger overall economy, while Shibin al Kawm has a lower GDP per capita and faces substantially higher mortgage interest rates (20.5%) compared to Rome's lower rate (2.0000000000000001%). Shibin al Kawm also shows a higher population growth rate, suggesting ongoing development pressures.
Assessing quality of life reveals significant challenges for Shibin al Kawm. Key indices measuring healthcare, environment, and safety are notably lower than those in Rome, indicating potential deficiencies in these essential urban services. While Rome generally scores higher across these fundamental aspects, Shibin al Kawm's scores are uniformly low, suggesting a lower standard of living in these critical areas compared to major European cities. The data does not provide specific, comparable quality metrics for Shibin al Kawm, focusing instead on localized scores within Egypt, leaving the overall quality picture less defined than Rome's established benchmarks.
Ultimately, the choice between Rome and Shibin al Kawm hinges on a critical trade-off between cost and quality. Shibin al Kawm offers significantly lower living expenses and more affordable housing, presenting an attractive option for budget-conscious individuals or investors seeking lower operational costs. However, this comes at the expense of a generally lower quality of life, particularly concerning healthcare, environmental conditions, and personal safety. Rome provides a higher standard of living with better infrastructure and services, but this desirable outcome requires bearing substantially higher costs for housing, goods, services, and real estate. The decision depends entirely on individual priorities regarding the value placed on financial savings versus the quality of urban living.
 Rome
Rome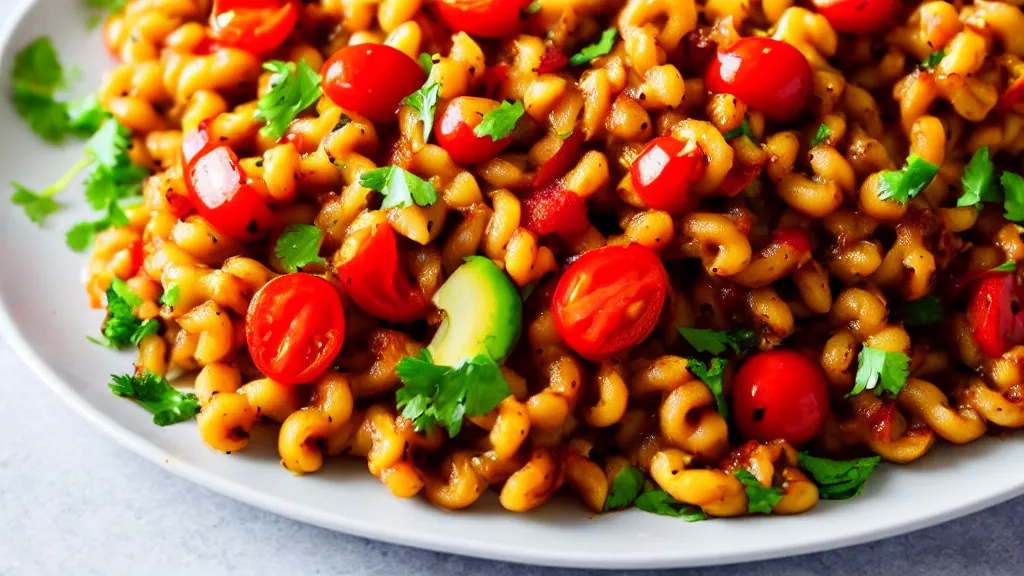 Shibin al Kawm
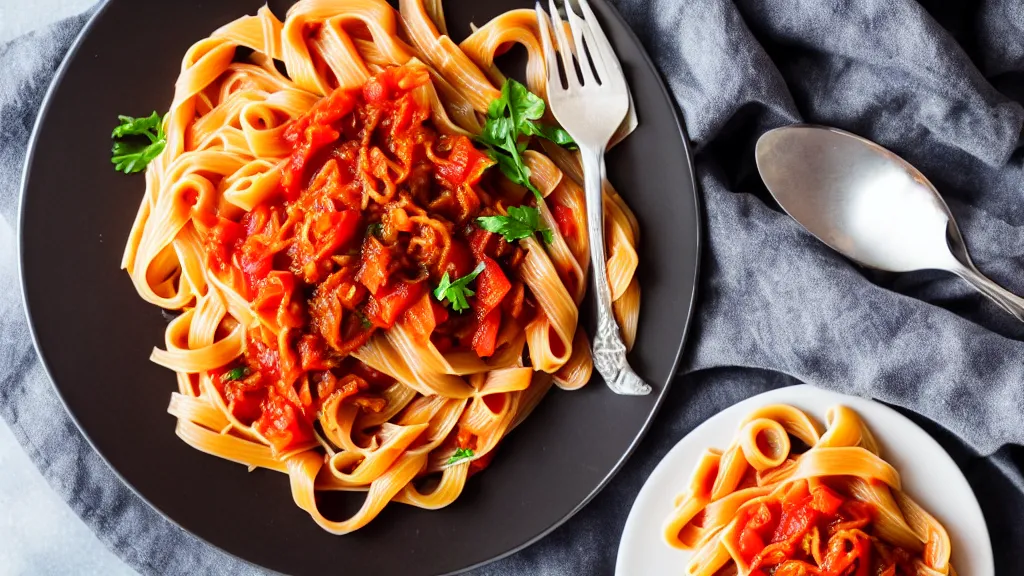
Local cuisine & dishes
Rome
Shibin al Kawm
 Rome
Rome Shibin al Kawm
Travel & attractions
Rome
Shibin al Kawm
Real estate & living comparison
| Rome | Shibin al Kawm | |
|---|---|---|
| International Primary School, Annual Tuition per Child | 14584.9 USD | 2281.81 USD |
| Private Full-Day Preschool or Kindergarten, Monthly Fee per Child | 585.38 USD | 82.95 USD |
| Jeans (Levi's 501 or Similar) | 70.02 USD | 29.25 USD |
| Men's Leather Business Shoes | 123.92 USD | 57.44 USD |
| Apples (1 kg) | 2.64 USD | 1.44 USD |
| Bananas (1 kg) | 2.32 USD | 0.64 USD |
| Bottled Water (0.33 Liter) | 1.5 USD | 0.12 USD |
| Cappuccino (Regular Size) | 2.27 USD | 1.39 USD |
| Annual Mortgage Interest Rate (20-Year Fixed, in %) | 3.27 USD | 20.5 USD |
| GDP Growth Rate: | 0.7 USD | 3.76 USD |
| Cinema Ticket (International Release) | 11.67 USD | 2.99 USD |
| Gasoline (1 Liter) | 1.97 USD | 0.35 USD |
| Taxi 1 Hour Waiting (Standard Tariff) | 35.01 USD | 2 USD |
| Basic Utilities for 85 m2 Apartment (Electricity, Heating, Cooling, Water, Garbage) | 216.81 USD | 13.37 USD |
| Broadband Internet (Unlimited Data, 60 Mbps or Higher) | 32.4 USD | 10.79 USD |
| Population | 2,748,109 | 267,945 |
Last updated: 2026-04-05T15:45:17+00:00
Comments for this comparison